Showing posts with label Advanced Analytics. Show all posts

Monday, January 18, 2016

OBIEE 12c Advanced Analytic part 7: EVALUATE_SCRIPT

This is the seventh part of OBIEE 12c Advanced Analytic:

  1. OBIEE 12c Advanced Analytics Functions part 1. Introduction & Trendline
  2. OBIEE 12c Advanced Analytic part 2: BIN and WIDTH_BUCKET
  3. OBIEE 12c Advanced Analytic part 3: Forecast
  4. OBIEE 12c Advanced Analytic part 4: Cluster
  5. OBIEE 12c Advanced Analytic part 5: Outlier
  6. OBIEE 12c Advanced Analytic part 6: Regression
  7. OBIEE 12c Advanced Analytic part 7: EVALUATE_SCRIPT (this one)
 (for 3-7 you need Enabling R and the relevant Analytics functions on OBIEE 12c )


The EVALUATE_SCRIPT function, like the rest of Evaluate family, helps us to call content external to OBIEE. In this case the function is not Database function, it is R script.
Since R is based on such packages, and they are free to download (https://cran.r-project.org/), modify and develop, this is a great bonus.( I have no intention guiding here about the R packages in general.)
  
Actually, the great post by Antony Heljula, at Peak Indicators blog,  Performing Real-Time Sentiment Analysis in Oracle BI 12c | Peak Indicators, made my post mostly redundant.
I will cover here just few very technical aspects.

Oracle documentation describes the syntax of this function.

Syntax

EVALUATE_SCRIPT( <script_file_path>, <column_name>, <options>,
[<runtime_binded_column_options>] )
Where:
script_file_path indicates the script XML file path. For example, filerepo//obiee.TimeSeriesForecast.xml.
column_name indicates the column name upon which to forecast.
options is a string list of names or value pairs separated by a semi-colon (;). For example, 'algorithm=GLM;CustomerID=%1;ActualRevenue=%2;YearsAsCustomer=%3',
runtime_binded_column_options indicates an optional variable list of column expression. You can specify one or more columns.

If you have seen the other R based functions syntax, you shouldn't be surprised here.
The big question is what is that mysterious "filerepo//"? The location of the "filerepo" is:
 [Installation_Home]/user_projects/domains/bi/bidata/components/OBIS/advanced_analytics/script_repository 
(In my personal case, OBIEE 12c installed in D\MWHOME12, so it's:
D:\MWHOME12\user_projects\domains\bi\bidata\components\OBIS\advanced_analytics\script_repository).

Checking the location will reveal the connection to R based script that I talked about in the previous posts:

So if you insist, the following 2 uses of outlier are equivalent:

EVALUATE_SCRIPT('filerepo://obiee.Outliers.xml', 'isOutlier', 'algorithm=mvoutlier;id=%1;arg1=%2;arg2=%3;useRandomSeed=False;', "Products"."Product Number", "Base Facts"."Revenue", "Base Facts"."Billed Quantity")

OUTLIER(( "Products"."Product Number"), ("Base Facts"."Revenue", "Base Facts"."Billed Quantity"), 'isOutlier','')  
That happens in an analysis with columns Product Number, Revenue and Billed Quantity.


Our examples were with Company, Product Type, Revenue and Billed Quantity in the analysis. It creates slightly more interesting option is the following couple, that returns the same results:
OUTLIER(( "Offices"."Company", "Products"."Product Type"), ("Base Facts"."Revenue", "Base Facts"."Billed Quantity"), 'isOutlier','')
EVALUATE_SCRIPT('filerepo://obiee.Outliers.xml', 'isOutlier', 'algorithm=mvoutlier;id=%1; arg1=%2;arg2=%3;useRandomSeed=False;',  "Offices"."Company"||"Products"."Product Type", "Base Facts"."Revenue", "Base Facts"."Billed Quantity")
Please note I had to use both Company and Product Type combination as ID. OBIEE does it for us automatically.
But what happens if I add a column (Year in our case) that is not in the outlier functions?
I have different result from the outlier function and the Evaluate_script one! That is because OBIEE automatically adds those columns as partitionByDimension. You can have up to 5 of those.
So we have the same outlier function as in the previous example with different results.
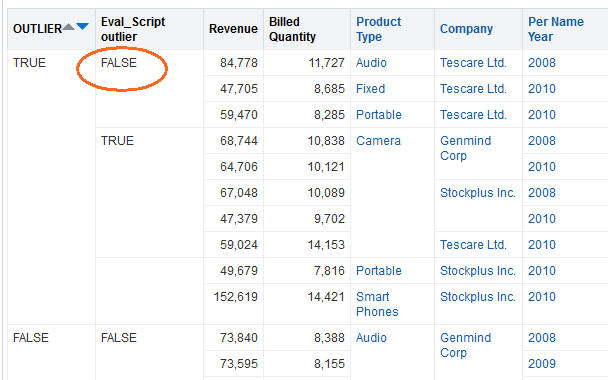
The correct EVAUATE_SCRIPT syntax now is:
EVALUATE_SCRIPT('filerepo://obiee.Outliers.xml', 'isOutlier', 'algorithm=mvoutlier;id=%1; partitionByDimension1=%2;arg1=%3;arg2=%4;useRandomSeed=False;',  "Offices"."Company"||"Products"."Product Type","Time"."Per Name Year", "Base Facts"."Revenue", "Base Facts"."Billed Quantity")
Now the results are the same:


I didn't find formal Oracle documentation about the XML files structure. From the existing files we can see the general format of:
  • inputs columns, those can be dimensions or other, with the relevant attributes for each such as name, sortorder, nilable, required...
  • outputs columns with attribute such as name, datatype(integer, double, varchar(20)...), aggr_rule...
  • options (I suspect that even if they aren't any, you should have this part)
  • scriptcontent - the actual function in the format:      function(dat, OPTION_COLUMNS) { library(THE_LIBRARY)   df <- THE_ACTUAL_CODE_WITH_PARAMETERS        return (df) }


Thursday, January 14, 2016

OBIEE 12c Advanced Analytic part 6: Regr

This is the sixth part of OBIEE 12c Advanced Analytic:

  1. OBIEE 12c Advanced Analytics Functions part 1. Introduction & Trendline
  2. OBIEE 12c Advanced Analytic part 2: BIN and WIDTH_BUCKET
  3. OBIEE 12c Advanced Analytic part 3: Forecast
  4. OBIEE 12c Advanced Analytic part 4: Cluster
  5. OBIEE 12c Advanced Analytic part 5: Outlier
  6. OBIEE 12c Advanced Analytic part 6: Regression (this one)
  7. OBIEE 12c Advanced Analytic part 7: EVALUATE_SCRIPT
 (for 3-7 you need Enabling R and the relevant Analytics functions on OBIEE 12c )


Linear Regression is a basic option of Advanced Analytics. I once wrote about achieving the regression line in OBIEE using the Oracle DB capabilities at "OBIEE and Linear Regression with Oracle DB".

Oracle documentation describes the REGR function: The REGR function fits a linear model and returns the fitted values or model. You can use this function to fit a linear curve on two measures.


Lets start with the simple example from the online documentation:
Analysis with columns Product Type, Brand Revenue and Discount Amount from Sample Sales. With a regression column. The simplified version is: REGR("Revenue", ("Discount Amount"), ("Product Type", "Brand"), 'fitted', '')
 
The full formula:  REGR("Base Facts"."Revenue", ("Base Facts"."Discount Amount"), ("Products"."Product Type", "Products"."Brand"), 'fitted', '')

So we have a "fitted" regression of Revenue vs. Discount Amount, where each point is combination of Product Type and Brand.

Lets see the syntax  documentation and do few more things:

Syntax

REGR(y_axis_measure_expr, (x_axis_expr), 
(category_expr1, ..., category_exprN), output_column_name,
options, [runtime_binded_options])
Where:
y_axis_measure_expr indicates the measure for which the regression model is to be computed.
x_axis_measure_expr indicates the measure used to determine the regression model for the y_axis_measure_expr.
category_expr1, ..., category_exprN indicates the dimension/dimension attributes used to determine the category for which the regression model for the y_axis_measure_expr is computed. One or up to five dimensions/dimension attributes can be provided as category columns.
output_column_name indicates the output column name for regression. Valid values are 'fitted', 'intercept', or 'modelDescription'.

output_column_name options explanation:
fitted - returns the points on regression line (y=ax+b) 
intercept - the intercept point with the zero on x axis (b from y=ax+b)
modelDescription - the Model in JSON format.

options indicates a string list of name/value pairs separated by a semi-colon (;). The value can include %1 ... %N, which can be specified using runtime_binded_options.
runtime_binded_options indicates an optional comma-separated (,) list of runtime binded columns or literal expressions.


From my personal testing, All the options in the documentation (algorithm, targetNames, showModelDescription) seems irrelevant at the moment. Mostly because they have only 1 relevant default value.


It seems that adding the intercept or modelDescription output to the analysis hides the measures. 


In case you are interested, the REGR("Base Facts"."Revenue", ("Base Facts"."Discount Amount"), ("Products"."Product Type", "Products"."Brand"), 'modelDescription', '') function returned the following JSON:


"{
 "call": {
 "": "lm",
"formula": "formula",
"data": "dat"
},
"terms": [
 "~",
"target",
"arg1"
],
"residuals": {
 "1":  41031,
"2":  88411,
"3": -1.3425e+05,
"4":  81339,
"5": -76497,
"6": -8371.3,
"7":  15573,
"8": -17995,
"9": -20080,
"10": -61277,
"11":  92117
},
"coefficients": [ {
 "Estimate":  10364,
"Std. Error":  54600,
"t value": 0.18981,
"Pr(>|t|)": 0.85367
},
{
 "Estimate":  29.39,
"Std. Error": 3.2705,
"t value": 8.9865,
"Pr(>|t|)": 8.6434e-06
} ],
"aliased": {
 "(Intercept)": false,
"arg1": false
},
"sigma":  76935,
"df": [ 2, 9, 2 ],
"r.squared": 0.89973,
"adj.r.squared": 0.88859,
"fstatistic": {
 "value": 80.757,
"numdf":      1,
"dendf":      9
},
"cov.unscaled": [ {
 "(Intercept)": 0.50366,
"arg1": -2.7311e-05
},
{
 "(Intercept)": -2.7311e-05,
"arg1": 1.8071e-09
} ]
}"


Usually we can add extra columns that are not in the REGR function to the analysis.
For example, similar to previous function, where I replaced Brand with Product and added the Department (from another dimension) to analysis.
REGR("Base Facts"."Revenue", ("Base Facts"."Discount Amount"), ("Products"."Product", "Products"."Product Type"), 'fitted', '')

The result is fine:


Tuesday, January 12, 2016

OBIEE 12c Advanced Analytic part 5: Outlier

This is the fifth part of OBIEE 12c Advanced Analytic:

  1. OBIEE 12c Advanced Analytics Functions part 1. Introduction & Trendline
  2. OBIEE 12c Advanced Analytic part 2: BIN and WIDTH_BUCKET
  3. OBIEE 12c Advanced Analytic part 3: Forecast
  4. OBIEE 12c Advanced Analytic part 4: Cluster
  5. OBIEE 12c Advanced Analytic part 5: Outlier (this one)
  6. OBIEE 12c Advanced Analytic part 6: Regression
  7. OBIEE 12c Advanced Analytic part 7: EVALUATE_SCRIPT
 (for 3-7 you need Enabling R and the relevant Analytics functions on OBIEE 12c )


Outlier detection is sometimes described as Anomaly detection. 
The Outlier function is part of the Analytics functions family. In documentation it's described: The OUTLIER function classifies a record as an outlier based on one or more input expressions using K-Means or Hierarchical Clustering or Multi-Variate Outlier detection Algorithms.

Outlier, like Clustering is a type of unsupervised learning. In clustering, objects of the data set are grouped into clusters, in such a way that groups are very different from each other and the objects in the same group or cluster are very similar to each other. In many cases, the Outliers are those values that don't fit well any of the existing cluster. It is not surprising that 2 out of available Outlier algorithms are shared with Cluster.
(When we are at academic mood we can read more about Multi-Variate Outlier detection here, for example. The other 2 algorithms were referenced in the Clustering post.)


I'll start with the online help example:
In the Analysis we have "Products"."Product",  "Offices"."Company", "Base Facts"."Revenue" and "Base Facts"."Billed Quantity". Lets add an outlier function.
Simplified version:
OUTLIER(("Product","Company"), ("Quantity","Revenue"), 'isOutlier', 'algorithm=mvoutlier')
Full function code:
OUTLIER(("Products"."Product", "Offices"."Company"), ("Base Facts"."Billed Quantity","Base Facts"."Revenue"), 'isOutlier', 'algorithm=mvoutlier')


I added "best Visualization" option, did some minor changes and got the graph Outlier based on MVOUTLIER algorithm:
Since MVOUTLIER is default, I get the same results with empty algorithms value (yet the empty parameter must exist):

OUTLIER(("Products"."Product", "Offices"."Company"), ("Base Facts"."Billed Quantity","Base Facts"."Revenue"), 'isOutlier','') 


Changing the last parameter to h-clustering (3 outlier points):
OUTLIER(("Products"."Product", "Offices"."Company"), ("Base Facts"."Billed Quantity","Base Facts"."Revenue"), 'isOutlier','algorithm=h-clustering')

And k-means (2 outlier points):
OUTLIER(("Products"."Product", "Offices"."Company"), ("Base Facts"."Billed Quantity","Base Facts"."Revenue"), 'isOutlier','algorithm=k-means')
 Return different results, as one could expect.


Attempt to add Cluster function parameters such as numClusters returned syntax error. So it's time to see the syntax:

Syntax

OUTLIER((dimension_expr1 , ... dimension_exprN), (expr1, .. exprN),
output_column_name, options, [runtime_binded_options]))])
Where:
dimension_expr indicates a list of dimensions.
expr represents a list of dimension attributes or measures to find outlier.
output_column_name indicates the output column name. Valid values are 'isOutlier' and 'distance'.
options indicates a string list of name/value pairs separated by a semi-colon (;). The value can include %1 ... %N, which can be specified using runtime_binded_options.
runtime_binded_options is an option comma separated list (,) of run-time binded columns and or literal expressions.


Option Name
Description
Values
algorithm
The algorithm to use.
mvoutlier (default)
h-clustering
k-means
useRandomSeed
This is TRUE by default. This is the value to use in PRODUCTION environment.
If set to FALSE, then we use set.seed(initialSeed) to ensure reproducibility. Used in QA/Debug environment.
TRUE (default)
FALSE
initialSeed
This value is used only when useRandomSeed is set to FALSE.
Integer (250 default)
topN
If isTopNAsPercentage is TRUE then return the topN % as outliers. Or else return the topN values as outliers.
Not relevant to mvoutlier? 
Double (default 3)

isTopNAsPercentage
This value is used with topN.
Not relevant to mvoutlier? 
TRUE
FALSE (default)
 

Here is another example of the MVOUTLIER algorithm, this time with distance output as well.
IsOutlier:
OUTLIER(("Products"."Product", "Offices"."Company"), ("Base Facts"."Billed Quantity","Base Facts"."Revenue"), 'isOutlier','')

distance:
OUTLIER(("Products"."Product", "Offices"."Company"), ("Base Facts"."Billed Quantity","Base Facts"."Revenue"), 'distance','')

As expected, those with the greatest distance are the Outliers:


Combining the Outlier results with Clustering might seem interesting:

K-means Clusters with outliers:
but it's actually meaningless, from what I see (in the R code as well) in both k-means and h-clustering algorithms, we create a single cluster and look for the distance there.For example the same results for distance calculations of outlier distance and cluster (non-normalized) distance for one cluster:

We can see the last 2 columns are identical. I used cluster distance function for 1 cluster:
CLUSTER(("Products"."Product", "Offices"."Company"), ("Base Facts"."Billed Quantity","Base Facts"."Revenue"),'distanceFromCenter', 'algorithm=k-means;numClusters=1;maxIter=10;useRandomSeed=FALSE;enablePartitioning=TRUE;normalizedDist=FALSE')
Outlier Distance Function:
OUTLIER(("Products"."Product", "Offices"."Company"), ("Base Facts"."Billed Quantity","Base Facts"."Revenue"), 'distance','algorithm=k-means')


From my testing, it seems that the topN and isTopNAsPercentage options work only with h-clustering algorithm:
OUTLIER(("Products"."Product", "Offices"."Company"), ("Base Facts"."Billed Quantity","Base Facts"."Revenue"), 'isOutlier','algorithm=h-clustering;isTopNAsPercentage=false;topN=10')

the others are indifferent to the options. This is strange, k-means, should have been influenced as well.

One last thing, mismatching the dimensions columns in the analysis with those in the outlier function might return error:

Error Codes: OPR4ONWY:U9IM8TAC:U9IM8TAC:U9IM8TAC:OI2DL65P
State: HY000. Code: 10058. [NQODBC] [SQL_STATE: HY000] [nQSError: 10058] A general error has occurred. (HY000)
State: HY000. Code: 43113. [nQSError: 43113] Message returned from OBIS. (HY000)
State: HY000. Code: 43119. [nQSError: 43119] Query Failed: Error(s): Error in covMcd(x, alpha = quan): n == p+1 is too small sample size for MCD (HY000)

Or make the system wonder how serious you are ([nQSError: 43119] Query Failed: Error(s): Error in covMcd(x, alpha = quan): n <= p -- you can't be serious!)


P.S.


I'm far from being a expert on the issue... But 2 more approaches to outliers based on clusters:

1. Sometimes small clusters are outliers by themselves. In those cases it might be interesting to check the very small clusters as outliers.

2. In some cases finding points that seems to belong to clusters but are at the far edges of the cluster might be interesting. in such cases the following might help:

I'll return to the k-means Cluster example from the previous post.In an analysis with Company, Product, Revenue and Billed Quantity columns, i have a Cluster:
CLUSTER(("Products"."Product", "Offices"."Company"), ("Base Facts"."Billed Quantity","Base Facts"."Revenue"),'clusterName', 'algorithm=k-means;numClusters=5;maxIter=10;useRandomSeed=FALSE;enablePartitioning=TRUE')   
I'll add the same function but with distanceFromCenter option:
CLUSTER(("Products"."Product", "Offices"."Company"), ("Base Facts"."Billed Quantity","Base Facts"."Revenue"),'distanceFromCenter', 'algorithm=k-means;numClusters=5;maxIter=10;useRandomSeed=FALSE;enablePartitioning=TRUE')


Now we can have outliers based on each cluster. Those values are by default normalized (0-100). Thanks to that we can select a constant number as a mark. I'll select the value of 65 distance from center, that marks outlier:

CASE WHEN (CLUSTER(("Products"."Product", "Offices"."Company"), ("Base Facts"."Billed Quantity","Base Facts"."Revenue"),'distanceFromCenter', 'algorithm=k-means;numClusters=5;maxIter=10;useRandomSeed=FALSE;enablePartitioning=TRUE') > 65) THEN 'Outlier' ELSE '' END

The same can be done using percentage or other, more appropriate, calculations.


Monday, January 11, 2016

OBIEE 12c Advanced Analytic part 4: Cluster

This is the fourth part of OBIEE 12c Advanced Analytic:

  1. OBIEE 12c Advanced Analytics Functions part 1. Introduction & Trendline
  2. OBIEE 12c Advanced Analytic part 2: BIN and WIDTH_BUCKET
  3. OBIEE 12c Advanced Analytic part 3: Forecast
  4. OBIEE 12c Advanced Analytic part 4: Cluster (this one)
  5. OBIEE 12c Advanced Analytic part 5: Outlier
  6. OBIEE 12c Advanced Analytic part 6: Regression
  7. OBIEE 12c Advanced Analytic part 7: EVALUATE_SCRIPT
 (for 3-7 you need Enabling R and the relevant Analytics functions on OBIEE 12c )


The Cluster function is part of the Analytics functions family. In documentation it's described: The CLUSTER function collects a set of records into groups based on one or more input expressions using K-Means or Hierarchical Clustering.


The popular demonstration of k-means Cluster explained nicely in Wikipedia.


Clustering is a type of unsupervised learning. In clustering method, objects of the data set are grouped into clusters, in such a way that groups are very different from each other and the objects in the same group or cluster are very similar to each other.
Remember, similarity is often hard to define
(Pictures from https://propuppy.wordpress.com/2012/11/19/owner-dog-look-alike/).

Our Clustering function can use 2 algorithms K-Means and Hierarchical Clustering. The K-Means is very good for cases when we can "draw a circle/ellipse" around every cluster, while the the hierarchical options tend to create a cluster within a cluster in a hierarchy.
K-Means tends to have better performance especially when the amount of data is growing.

Read more about in Data Clustering: K-means and Hierarchical Clustering by  Piyush Rai or OBIEE specific Comparison Between K-Mean and Hierarchical Algorithm Using Query Redirection by Manpreet kaur and Usvir Kaur

I'll start with the online help example:
Analysis with Product, Company, Revenue and Billed Quantity columns.

 The Cluster Function is (simplified)

CLUSTER((""Product", "Company"), ("Billed  Quantity","Revenue"),'clusterName', 'algorithm=k-means;numClusters=%1;maxIter=%2;useRandomSeed=FALSE;enablePartitioning=TRUE', 5, 10)

Another option to write the same:
CLUSTER((""Product", "Company"), ("Billed  Quantity","Revenue"),'clusterName', 'algorithm=k-means;numClusters=5;maxIter=10;useRandomSeed=FALSE;enablePartitioning=TRUE')

actual function:
CLUSTER(("Sales"."Products"."Product", "Sales"."Offices"."Company"), ("Sales"."Facts"."Billed Quantity","Sales"."Facts"."Revenue"),'clusterName', 'algorithm=k-means;numClusters=%1;maxIter=%2;useRandomSeed=FALSE;enablePartitioning=TRUE', 5, 10)

A resulting graph, where revenue and Billed Quantity are the Axes and each point is combination of company and product (the clusters are color and shapes):


Here is the same but with h-clustering instead of k-mean algorithm.
 

There seems to be some undocumented default of 5 clusters, so the following Cluster function:
CLUSTER(("Products"."Product", "Offices"."Company"), ("Base Facts"."Billed Quantity","Base Facts"."Revenue"),'clusterName', 'algorithm=k-means;')
returns:


And removing the algorithm part as well:
CLUSTER(("Products"."Product", "Offices"."Company"), ("Base Facts"."Billed Quantity","Base Facts"."Revenue"),'clusterName', '')
returned results similar to the k-means result with 5 clusters.


Time to see the formal Syntax:

Syntax 


CLUSTER((dimension_expr1 , ... dimension_exprN), (expr1, .. exprN),
output_column_name, options, [runtime_binded_options])
Where:
dimension_expr indicates a list of dimensions to be clustered (each point you see on my graphs is combination of dimension_expressions).
expr indicates a list of dimension attributes or measures to use to cluster dimension_expr (those are the axis in the graphs).
output_column_name indicates the output column name for the cluster. Valid values are 'clusterId', 'clusterName', 'clusterDescription', 'clusterSize', 'distanceFromCenter', and 'centers'. (you can use few similar cluster functions with different Output_column_name in the same analysis)
options indicates a string list of name/value pairs separated by a semi-colon (;). You can include %1 ... %N, which can be specified using runtime_binded_options.
runtime_binded_options indicates a comma separated list (,) of run-time binded columns or literal expressions.

Output Columns The CLUSTER function output contains the following columns: 
  • clusterID – This column is the cluster number or ID. 
  • clusterName – This column is the name of the cluster. It is the same as clusterID. 
  • clusterDescription – The description can be added by the end user after the cluster dataset is persisted into DSS. 
  • clusterSize – This column is the number of elements in the current cluster. 
  • distanceFromCenter – This column indicates how far the current cluster element is from the center of the current cluster. 
  • centers – This column indicates the center of the current cluster.
More about parameters:
 
Option Name
Description
Values
algorithm
The algorithm to use for clustering.
k-mean default?
h-clustering
method
The method within the algorithm.
For k-means algorithm: Hartigan-Wong, Lloyd, Forgy (last 2 are same algorithm), MacQueen
Default is Hartigan-Wong.
For h-clustering algorithm: ward.D, ward.D2, single, complete, average, mcquitty, median, or centroid.
Default is complete.
numClusters
The number of clusters. Every record is assigned to one of the clusters.
Integer. Is 5 the default?
attributeNames
The attributes to consider for clustering.
arg1,arg2,arg3,arg4,arg5,arg6,arg7,arg8,arg9,arg10
maxIter
The number of iterations to create clusters.
Integer. Default 20.
normalizedDist
Normalizes the distance between 0 to 100 if set to TRUE.
TRUE
FALSE
Default is TRUE.
useRandomSeed
Set to TRUE by default. If set to TRUE, then is the value to use in PRODUCTION environment.

If set to FALSE, then use set.seed(initialSeed) to ensure reproducibility, used in QA/Debug Environment.
True
False
Default is TRUE.
initialSeed
This value is used only when useRandomSeed is set to FALSE.
Integer
Default is 250.
clusterNamePrefix
If set, then this is the prefix for the cluster name.
Varchar
Default is empty.
clusterNameSuffix
If set, then this is the suffix for the cluster name.
Varchar 
Default is empty.


What have we learned from this?

First of all, the examples are BAD for production, it's better to work with useRandomSeed=TRUE

We can have a Cluster name prefix:
CLUSTER(("Products"."Product", "Offices"."Company"), ("Base Facts"."Billed Quantity","Base Facts"."Revenue"),'clusterName', 'algorithm=k-means;numClusters=5;clusterNamePrefix=Cluster ')


When setting clusters based on some random selection, the algorithm tends to make few iteration to "recalibrate" itself.  MaxIter parameter controls the max number of attempts to do the "recalibration".


Here are few additional output options, run on the same k-means cluster:
I used:
  • clusterName
  • clusterSize
  • centers
  • distanceFromCenter
Please note the distanceFromCenter is normilized on scale 0-100 by default.


One last example: I wanted to see that using different methods in the same algorithm would cause variations in results. I used the K-mean cluster method as parameter from a prompt, with that parameter value as prefix, for readability. It's actually the same parameter.
When comparing methods we can't have random results, so we must have useRandomSeed=FALSE:
I used:
CLUSTER(("Products"."Product", "Offices"."Company"), ("Base Facts"."Billed Quantity","Base Facts"."Revenue"),'clusterName', 'algorithm=k-means;method= %1;numClusters=5;useRandomSeed=FALSE;clusterNamePrefix=%2', '@{P_Method}{Hartigan-Wong}',  '@{P_Method}{Hartigan-Wong}')
(I had to enter the same runtime_binded_option twice, despite the fact it has the same value, we don't like reuse in this function).

As one might have expected, different methods return small variations in results (sorry about my drawing capabilities):


Removing columns from the criteria (but no the cluster function) would not cause any error, both for dimensions and attributes and will not change the number of rows returned (though removing the dimension might make result almost meaningless). 

Few more points:

It should be crystal clear. the default of the system is useRandomSeed=TRUE. As a result the clusters order and even result might not be consistent, even on the same data. 
For example, the following function: CLUSTER(("Products"."Product", "Offices"."Company"), ("Base Facts"."Billed Quantity","Base Facts"."Revenue"),'clusterName', 'algorithm=k-means;numClusters=5;maxIter=10')
First run:

Second run:


My small personal experience:
Selecting the correct number of Clusters is not always easy. Often we might change our selection based of the results we see. In cases they are more then two expressions (Revenue and Billed Quantity in our case), it might be educational to set clusters by pairs of them, just for the graphical output.


I will return to few other options of Cluster in the next post.