Saturday, July 27, 2013

OBIEE - Correct totals in Order and Payment lines

I had a request from a customer to solve an issue of repeating values and correct totals.
This issue is better solved in a correct data model, but lets go for the quick and dirty aproach.
We have a table: 
  • Order Number
  • Order total
  • Payment Number 
  • Payment Sum
Since they are usually several payments for each Order, the Order total is repeating, and we have wrong totals:
For Order 100 we have a total for Order Total of 400 instead of 200, for 110 it's 900 instead of 300. The total should be 500, but it's 1300.

What should I do? 
In the Order Total column formula I'll change it from "ORDER_PAYMENTS"."Order Total" to AVG("ORDER_PAYMENTS"."Order Total" by "ORDER_PAYMENTS"."ORDER_NUMBER")    (max or min are as good).

The result has correct totals for each order, but wrong grand total.

So the last part, is to change the aggregation rule of the problematic column to sum:

Now all the totals are correct.

Saturday, July 20, 2013

OBIEE dual Y bar using BI Publisher

 For some reason, BI Publisher and Answers have a different set of possible graphs (named Graphs in Answers - Analysis and Charts in Publisher - Report).
In BI Publisher there are some very interesting dual Y bar Charts:
For Lines:

For Areas:

For bars:

And even for scattered points:

The big advantage here, comparing to other techniques I talked about (OBIEE dual Y line chart / graph using Javascript, OBIEE - Narrative and dual Y axis Google Chart), is the integration with OBIEE Semantic model in the latest releases. So I can do a report directly on top of a Subject area or (in earlier releases), on top of an Analysis.

For example:
Lets create a new report:

And base it on a Subject Area (Sample Sales Lite, in this case)

I don't want any guide and use a report editor.
Lets save the report and select any template you like. I took the empty one.
I'll drag a chart object from the Insert option.

And put relevant column in the chart. Do not drag anything to the Series. It will prevent the dual Y option. You want 2 measures at the Values part.

Click on the Chart.
In the Chart menu select the Dual Line or whatever dual type you want.

We are almost done:


Now Save the layout and the report.

You might want to make the entire report smaller by clicking an empty part of the layout and selecting properties on the left:

 
And add the Report to the dashboard of your choice.

Here you have 2 problems:

1. You can't print Publisher report in a dashboard a part of the Dashboard. Not even as HTML as the 2 other option could.
According to Oracle documentation (Users Guide, Chapter 4):
About Briefing Books and Printing BI Publisher Reports
If you plan to print a dashboard page that contains a BI Publisher report or to include the page in a briefing book, then you must keep the following points in mind:

  • If you print the briefing book as PDF and if the output format of the BI Publisher report is PDF, then the BI Publisher report is printed after the other objects on the page. If you print a dashboard page that contains a BI Publisher report as PDF, but the dashboard page is not part of a briefing book, then the BI Publisher will not be printed.
  • If you print the dashboard page or briefing book as MHTML, then the BI Publisher report will not be printed.
 So we can print it with a briefing book.We can even run an agent on a dashboard that contains Publisher report, as long as they are all PDF (see there).
Starting with 11.1.1.7 you can semi automatically create a publisher report out of the entire dashboard page, and print it.

2. The Publisher reports in Dashboard keep their header.

  You can solve the first problem by embedding a link and not the actual Publisher Report in the dashboard.For example press Export

as Interactive View or HTML and copy the URL.
Remove the server name and port and all the sufixes.
For example, now I have 2 URLs:

 Interactive:
/xmlpserver/viewer.jsp?_xpf=&_xpt=1&_xdo=%2F~weblogic%2FPub_dualY.xdo&_xmode=2&_xt=Dual+Y+Chart

(the original URL was: http://bdahab-lap:9704/xmlpserver/viewer.jsp?_xpf=&_xpt=1&_xdo=%2F~weblogic%2FPub_dualY.xdo&_xmode=2&_xt=Dual+Y+Chart&_xf=analyze&_xautorun=false&_xana=view )

HTML:
/xmlpserver/servlet/xdo?_xpt=1&_xdo=%2F~weblogic%2FPub_dualY.xdo&_xt=Dual%20Y%20Chart&_xf=html

I placed both in Embedded content objects:

The result is

(left one - Real publisher report, central - HTML, right one interactive, bellow - PDF)

Pick your own choice.


You might want to see:OBIEE - Dual Y axis line and Dual axis Bar charts: the easy, unsupported and not recommended way

Tuesday, July 16, 2013

OBIEE - creating new SmartView connection

I talked about Smart View in a previous post: OBIEE 11.1.1.7 - The Excel Ready Version, including Smart View. So we know Smart View is Hyperion tool that enables you to create new reports and run existing reports/Analysis, directly from Excel.
We know you can download the 32bit Office version from OBIEE home page and 64bit version from Oracle.

I wanted to write this post specifically how to create Smart View connections to OBIEE. All 3 types of them.

I use here the new Smart View 11.1.2.3.0, since I already upgraded to OBIEE 11.1.1.7.1 as described here: Installing OBIEE patch set 11.1.1.7.1 on Windows
I'm not aware of major differences regarding this post.


When we are using Smart View with OBIEE, there are 3 types of connections to OBIEE we can create in Smart View:
1. Private
2. Shared Local
3.Shared on the Server

Lets review the 3 options:

Private Connection:


From Smart View ribbon, click Panel.

Select Private Connection.


Press the right arrow and Create New Connection.

Select Oracle BI EE.

Enter the URL http://servername:port/analytics/jbips
In my case http://bdahab-lap:9704/analytics/jbips

Enter the user / password.

Save it as Private Connection.


Now you can start working.

Press Connect. Enter Password if needed...
You can select anything from the connection to run.

After you do it, you can see the Oracle BI EE menu.

And create new reports with Smart View.  (I couldn't find any option to open this menu without opening an existing report first... Anyone?).

Next time we enter Excel, we can select Panel -> Private Connection again. 
This time we only need to use the previous connection from the pull down.


Shared Local Connection

Create an XML file. For example SmartView.XML. All we care for is the XML extension.

In the file I used the following content:

 <?xml version="1.0" encoding="UTF-8"?>
<res_GetProvisionedDataSources>
<Product providerType="ExtensionProvider" id="27EE9B0D-D5F5-42c9-AFC5-44FEA770C693"
name="OBI EE-11.1.1.7" displayVersion="version">
<Server name="Oracle BI, Fusion Edition" context="OBI:http://bdahab-lap:9704/analytics/jbips"></Server>
</Product>
</res_GetProvisionedDataSources>


  • Replace bdahab-lap:9704 with your server name and port.
  • Replace "Oracle BI, Fusion Edition" (Server Name), with the Name you want to see in the connection in Smart View.
Save the file.

Copy this file (SmartView.xml) to the bin directory of SmartView installation (other locations are possible). In my case it's C:\oracle\SmartView\bin.

Enter Excel, in Smart View ribbon select Options / advanced.
Update the Shared Connections URL to point to your XML file. In my case: C:/oracle/SmartView/bin/SmartView.XML
(Ensure that you use forward slashes (/) as separators in the file path)

Now you can use Smart View Shared local connection:
As usual Panel / Shared Connections
select your connection from the Pull Down and Enter password.


Shared Server Connection

Is very similar to Shared Local Connection. The only difference, is locating the XML file on a shared server. In OBIEE, the logical place is analyticRes, described here: analyticsRes - having your own place on the OBIEE. So I copied the same xml file as described  above (I copy / paste the same text, except the file name):

Create an XML file. For example SmartViewProviders.xml.


In the file I used the following content:

 <?xml version="1.0" encoding="UTF-8"?>
<res_GetProvisionedDataSources>
<Product providerType="ExtensionProvider" id="27EE9B0D-D5F5-42c9-AFC5-44FEA770C693"
name="OBI EE-11.1.1.7" displayVersion="version">
<Server name="Oracle BI, Fusion Edition" context="OBI:http://bdahab-lap:9704/analytics/jbips"></Server>
</Product>
</res_GetProvisionedDataSources>


  • Replace bdahab-lap:9704 with your server name and port.
  • Replace "Oracle BI, Fusion Edition" (Server Name), with the Name you want to see in the connection in Smart View.
Save the file.
Place the file in the analyticsRes directory. In my case I created SmartView directory in the analyticsRes directory (D:\or\MWHOME\instances\instance1\bifoundation\OracleBIPresentationServicesComponent\coreapplication_obips1\analyticsRes\ ) and placed the file there.

Now we have access to it using the URL: http://bdahab-lap:9704/analyticsRes/SmartView/SmartViewProviders.xml (pay attention to upper / lower case letters.)


Please note: when I tried to use the file SmartView.XML, I used in the previous section, it didn't work. It did work after I renamed the file to SmartViewProviders.xml . Why? Sorry, you should look for a deeper person.


Most of the materials here are from the Smart View Users guide. There you can find also possible settings of the XML file, to fit additional EPM products.
The Smart View 11.1.2.3 documentation is located here.
(we can get to Smart View docs from this EPM documentation page.)

Monday, July 15, 2013

Installing OBIEE patch set 11.1.1.7.1 on Windows

Please note OBIEE Bundle Patch 11.1.1.7.151020 is available. You might prefer it.

First download the single big patch file of  Patch 16556157 and the small file of  Patch 16569379 as described in OBIEE 11.1.1.7.1 Bundle Patch is available .
Unzip them. You should have 2 directories named by the patch number.
Now in the directory 16556157, you have 6 directories and a useless readme_16556157.htm.
In sub-directory 16453010, you have the real readme.htm with the "what's new" and the installation guidelines.

The first thing we are advised to do is to back up the Oracle BI system, including the following:
  •     The <Oracle BI Home>\bifoundation\server directory.
  •     The <Oracle Instance>\bifoundation\OracleBIServerComponent\coreapplication_obis1\repository directory.
  •     The <Oracle BI Home>\bifoundation\jee\mapviewer.ear\web.war\WEB_INF\conf\mapViewerConfig.xml file, if you have modified it.
There is a tip: The location of the Oracle BI Home directory and the Oracle Instance directory depend on where Oracle BI was originally installed, and on the platform. For example:
        On UNIX, the Oracle BI Home directory might be prod_mwhome/Oracle_BI1
        On Windows, the Oracle BI Home directory might be c:\prod_mwhome\Oracle_BI1
In my case it's D:\or\MWHOME\Oracle_BI1\bifoundation\server and D:\or\MWHOME\instances\instance1\bifoundation\OracleBIServerComponent\coreapplication_obis1\repository.
I prefer to backup D:\or\MWHOME\instances\instance1\bifoundation\OracleBIPresentationServicesComponent\coreapplication_obips1\catalog as well.

In point 2 of my version of readme, there is a little mistake, you are advised to download each patch separately... You won't find them, there are all part of the big patch file 16556157.

In point 4 you are advised to stop the BI System and told how to do it, step by step. It's all very nice but to me it looks simpler just to run "Stop BI Services" from the Start/All Programs/Oracle Business Intelligence menu. I guess wee see the full details due to Linux needs (and anyway, it's very educational).

Point 5 advises to clear cache: from <Oracle BI Home>\bifoundation\web\catalogmanager\configuration\ (in my case D:\or\MWHOME\Oracle_BI1\bifoundation\web\catalogmanager\configuration\) you should delete 2 files (if they exist) org.eclipse.osgi  &  org.eclipse.equinox.app.

As you remember we have directory 16556157 with 6 sub-directories. Copy or move the sub-directories to <Oracle BI Home> (in my case D:\or\MWHOME\Oracle_BI1). That's 2.5 GB to copy.
Copy there the extracted directory 16569379 as well. (much nicer the 11.1.1.6.X with the special instruction for the jdeveloper patch.)

Open CMD prompt as Administrator on <Oracle BI Home>. 

The readme states:

On UNIX: If you are using a command shell derived from the C shell, then set the environment variables by entering the following:
setenv ORACLE_HOME $PWD
setenv PATH $ORACLE_HOME/bin:$PATH
setenv JAVA_HOME $ORACLE_HOME/jdk
setenv PATH $JAVA_HOME/bin:$PATH
setenv PATH $ORACLE_HOME/OPatch:$PATH
 
On Windows: If the Oracle BI Home directory is C:\prod_mwhome\Oracle_BI1, then set the environment variables by entering the following:
set ORACLE_HOME=C:\prod_mwhome\Oracle_BI1
set PATH=%ORACLE_HOME%\bin;%PATH%
set JAVA_HOME=%ORACLE_HOME%\jdk
set PATH=%JAVA_HOME%\bin;%PATH%
set PATH=%ORACLE_HOME%\OPatch;%PATH%
 (in my case the first line is set ORACLE_HOME=D:\or\MWHOME\Oracle_BI1)
DON'T leave empty spaces in the set, such as set ORACLE_HOME=   D:\or\MWHOME\Oracle_BI1. 
Right Click does the paste action in CMD window.
After you run the set statements, enter each patch directory and run  opatch apply. Wait for the  "Opatch Succeeded" and repeat in the next directory.
 
For example I started with 16453010:
And followed with the rest.
cd..\16849017
opatch apply
cd..\16916026
opatch apply
cd..\16850553
opatch apply
cd..\16869578
opatch apply
cd..\16842070     
opatch apply
 cd..\16569379
opatch apply
The last one requests you to confirm the instance is shut down.

You are advised to check all patches were applied using opatch lsinventory:

The next part has some manual labor (I use the readme numbers starting with 11):

11. Copy the BIPublisherDesktop32.exe and BIPublisherDesktop64.exe files from the <Oracle BI Home>\clients\bipublisher\repository\Tools directory to the prod_mwhome\user_projects\domains\bifoundation_domain\config\bipublisher\repository\Tools directory.
In my case, from D:\or\MWHOME\Oracle_BI1\clients\bipublisher\repository\Tools to D:\or\MWHOME\user_projects\domains\bifoundation_domain\config\bipublisher\repository\Tools.
(Should I copy ExcelAnalyzer.exe as well?)

12. Copy the msmdacc64.dll file from the <Oracle BI Home>\clients\bipublisher\repository\Admin\DataSource directory to the prod_mwhome\user_projects\domains\bifoundation_domain\config\bipublisher\repository\Admin\DataSource directory.
There seems to be a problem here since the source does not exist. I don't know if it's a documentation bug or missing file. 

13.  Remove the jsp_servlet subdirectory associated with Oracle BI Publisher (if it exists), as follows:

  A.  Go to the directory containing the jsp_servlet subdirectory (using a file manager application or the command line). If it exists, then the jsp_servlet subdirectory is located in one of the directories below the <Middleware Home>/<Domain Home>/servers/bi_server1/tmp/_WL_user/bipublisher_11.1.1 directory.

    For example:
        On UNIX: If the Middleware Home directory is /prod_mwhome and the Domain Home directory is /user_projects/domains/bifoundation_domain, then go to the following directory:
        /prod_mwhome/user_projects/domains/bifoundation_domainservers/bi_server1/tmp/_WL_user/bipublisher_11.1.1
        On Windows: If the Middleware Home directory is C:\prod_mwhome and the Domain Home directory is \user_projects\domains\bifoundation_domain, then go to the following directory:
        C:\prod_mwhome\user_projects\domains\bifoundation_domainservers\bi_server1\tmp\_WL_user\bipublisher_11.1.1

B.  Look in each directory below <Middleware home>/<Domain home>/servers/bi_server1/tmp/_WL_user/bipublisher_11.1.1, and remove any jsp_servlet subdirectory that you find.

  14. If you backed up mapViewerConfig.xml because it had been modified, then copy the backed-up file to its original location at <Oracle BI Home>\bifoundation\jee\mapviewer.ear\web.war\WEB_INF\conf\.

Now you should be able to start the server, but before you do, there is one more part not in the readme file.

 You might remember the post of Abhinav Agarwal  Smart View Version to use with OBIEE 11.1.1.7.1
You are advised there to download the new SmartView here. Both zip files seem to be the same. They contain both SmartView files (the 32 and 64 bit).

The readme there states:
"With the availability of Oracle Business Intelligence Enterprise Edition release 11.1.1.7.1, it will no longer be possible to make use of the default Oracle Smart View client installer which is available through the Oracle BI EE Home Page. For this release only, it will be necessary to access an updated version of the Oracle Smart View client installer version 11.1.2.3.000_16909989 (from My Oracle Support), or later.

This updated version can be used to replace the default Oracle Smart View installer in the default Oracle BI EE Home Page location

/<middleware>/Oracle_BI1/clients/epm/SmartView/SmartView.exe
/<middleware>/Oracle_BI1/clients/epm/SmartView/SmartView-x64.exe
2.    Make backup copies of smartview.exe and version.xml before deploying the replacement files.

3.    Download the Smart View zip file from My Oracle Support.

4.    Unzip the file.

5.    Copy smartview.exe and version.xml to the location of the Workspace installation, typically: C:\Oracle\Middleware\EPMSystem11R1\common\epmstatic\wspace\SmartView"

Well you don't have to go to support... you just downloaded the zip file.
Backup  <Oracle BI Home>\clients\epm\SmartView (In my caseD:\or\MWHOME\Oracle_BI1\clients\epm\SmartView),  extract the content of the Zip file to that directory. 

You might want to delete the patch installation files from <Oracle BI Home> and free the 2.5GB of disk space.

Now you can Start up the server. Bon Voyage.


P.S.

I just noticed there is a nice post HERE by Robin Moffatt from Rittman Mead, about "Patch OBIEE the quicker way – with OPatch napply" and they use the 11.1.1.7.1 example.


P.S.S.

You might also be interested in:

PATCH 17606196 for OBIEE 11.1.1.7.1 - IE10 & Chrome 30 solution

Exalytics X3-4 is available

Oracle published Exalytics X3-4 availability here, with twice as much memory and 2.4 TB of Flash storage:

From the press release it seems to support OBIEE 11.1.1.7, Endeca 3.0 and EPM 11.2.3.
That reminds me; In the OBIEE patch 11.1.1.7.1 there is a new feature "Support for TimesTen Parallel Insert", it seems to be ideal for Exalytics.

Here are some quotes:

The new Exalytics X3-4 system features 2 TB of main memory, 2.4 TB of flash storage, and 5.4 TB of hard disk. Oracle also released system upgrades to increase memory capacity for existing Exalytics X2-4 customers, and updated software for all Exalytics customers.

The software foundation for Oracle Exalytics X3-4 includes:
Oracle Business Intelligence Foundation Suite 11.1.1.7 delivers more than 200 enhancements across the suite and many features targeted exclusively for Oracle Exalytics. Examples of benefits for Exalytics customers include extremely fast ‘hot-data’ recommendations from the database and high-volume bursting with Oracle BI Publisher, to generate hundreds of thousands of personalized reports and documents for business users in time periods that were previously unachievable. In addition to these, Oracle Essbase, a component of Oracle Business Intelligence Foundation Suite, also benefits from Flash memory and expanded main memory. Customers can expand planning across the enterprise, compress planning cycles, and deliver relevant, data driven insights to all lines of business.
Oracle Endeca Information Discovery 3.0 enables rapid insights into new sources of data including unstructured content in social media, websites, content management systems, raw text from documents, email, and more. By correlating this data to the structured data in data warehouses and enterprise applications, users will be able to more accurately manage data and meaning form unstructured sources, ultimately driving better business decisions and innovations.
Oracle Hyperion Enterprise Performance Management (EPM) System Release 11.1.2.3 is the latest release of Oracle’s industry-leading enterprise planning, reporting and financial close applications. With updates to user experience, added functional capabilities and new powerful integrations, this new release empowers organizations to plan for profitable growth and report with confidence. Delivering faster and more granular profitability analysis, Oracle Hyperion Profitability and Cost Management is now certified to run on Oracle Exalytics In-Memory Machine and pre-configured to enable multidimensional reporting. This release also includes direct integration of Oracle Business Intelligence Enterprise Edition on Oracle Exalytics with Hyperion Financial Management to deliver rich, pre-built analytics on consolidated financial results.


This is a link to the the updated certification matrix (Some browsers don't "like" this link since it points to Excel file).


Monday, July 8, 2013

OBIEE dual Y line chart / graph using Javascript

In the new 305 SampeApp VM (Virtual Machine) available here  there is a sample of Dual Y line chart in dashboard 3.2, page Dyal Y Axis.
I wanted to find out how it is done, since it seems safer than using external engine such as  Google, described here. (There is also a post named OBIEE dual Y bar using BI Publisher and you might want to see:OBIEE - Dual Y axis line and Dual axis Bar charts: the easy, unsupported and not recommended way).
I could see on the chart, those are highchart.com java scripts. I don't know the legal aspect, but just for the sake of testing I copied the scripts folder from the VM to my local installation.
In case you don't have AnalyticsRes set up on your BI Server, please do, as described here.
So I copied the SampleApp/scripts folder under AnalyticsRes on the VM to the equivalent on my computer (MWHOME\instances\instance1\bifoundation\OracleBIPresentationServicesComponent\coreapplication_obips1\analyticsRes\SampleApp\Scripts). It is ~1MB of scripts.

In OBIEE I created an Analysis based on Sample Sales Lite:

 and copied the Narrative definition from the SampleApp. I couldn't  see it in the results tab but in the "show results how it will look in the Dashboard" It looked interesting:
Off course the legend and the scale legend was all wrong and needed fixing.

This was the original Narrative:

Header:

<script type='text/javascript' src='/analyticsRes/SampleApp/Scripts/highcharts/JQuery/jquery-1.8.2.min.js'></script>
<script src='/analyticsRes/SampleApp/Scripts/highcharts/highcharts.js'></script>
<script src='/analyticsRes/SampleApp/Scripts/highcharts/modules/exporting.js'></script>

<script type='text/javascript'>
$(function() {

var options = {
           chart: { renderTo: 'container2', zoomType: 'xy' },
                                                title: { text: 'Evolution Three different scale on the same chart' },
                                                subtitle: { text: 'Source: OBIEE SampleApp' },
                                                xAxis: [{ categories: [] }],
                                                yAxis: [
                                                                { labels: { formatter: function() { return this.value +' USD'; }, style: { color: '#89A54E' } }, title: { text: 'Unit Price', style: { color: '#89A54E' } } },
                                                                { gridLineWidth: 0, title: { text: 'Process Time', style: { color: '#AA4643' } }, labels: { formatter: function() { return this.value +' days'; }, style: { color: '#AA4643' } }, opposite: true },
                                                                { labels: { formatter: function() { return this.value +''; }, style: { color: '#89A54E' } }, title: { text: '# of Orders', style: { color: '#89A54E' } } }
                                                ],
                                                tooltip: { formatter: function() {var unit = { 'Temperature': '°C', 'Sea-Level Pressure': 'mb','test':'' }[this.series.name]; return ''+this.x+':'+this.y ; } },
                                                legend: { layout: 'vertical', align: 'left', x: 120, verticalAlign: 'top', y: 80, floating: true, backgroundColor: '#FFFFFF'},
                                                series: [
                                                                {name: 'Unit Price', type: 'spline', color: '#AA4643', yAxis: 1, marker: { enabled: false }, dashStyle: 'shortdot', data : []},
                                                                {name: 'Process Time', color: '#89A54E', type: 'spline', data: [] },
                                                                {name: '# of Orders', color: '#3ADF00', type: 'spline', data: [],  yAxis: 2 } ]
                                                };


Body:

options.series[0].data.push(parseFloat("@2".replace(" ", "")));
options.series[1].data.push(parseFloat("@3".replace(" ", "")));
options.series[2].data.push(parseFloat("@4".replace(" ", "")));
options.xAxis[0].categories.push('@1');                                               


Postfix:

var chart = new Highcharts.Chart(options);
});
</script>
<div id='container2' style='min-width: 850px; height: 400px; margin: 0 auto'></div>


we can see the 3 Javascripts being used:
'/analyticsRes/SampleApp/Scripts/highcharts/JQuery/jquery-1.8.2.min.js'
'/analyticsRes/SampleApp/Scripts/highcharts/highcharts.js'
'/analyticsRes/SampleApp/Scripts/highcharts/modules/exporting.js'


 The last one "exporting.js", is optional. It is responsible for the print and export options on the right top.


So it seems all changes need to be done in the header.

I'm OK with the internal Left Axis, but I want to rename it to Revenue.
So it's
 { labels: { formatter: function() { return this.value +' USD'; }, style: { color: '#89A54E' } }, title: { text: 'Revenue', style: { color: '#89A54E' } } },
instead of:
{ labels: { formatter: function() { return this.value +' USD'; }, style: { color: '#89A54E' } }, title: { text: 'Unit Price', style: { color: '#89A54E' } } },

the Right Axis was described here:
{ gridLineWidth: 0, title: { text: 'Process Time', style: { color: '#AA4643' } }, labels: { formatter: function() { return this.value +' days'; }, style: { color: '#AA4643' } }, opposite: true },
And I changed it to 
{ gridLineWidth: 0, title: { text: 'Billed Quantity', style: { color: '#AA4643' } }, labels: { formatter: function() { return this.value +' Units'; }, style: { color: '#AA4643' } }, opposite: true }, 

the opposite:true is a good hint, where it is located.

There are actually 2 Axis on the left so the leftmost of them was changed from:
{ labels: { formatter: function() { return this.value +''; }, style: { color: '#89A54E' } }, title: { text: '# of Orders', style: { color: '#89A54E' } } } 
to: 
{ labels: { formatter: function() { return this.value +'USD'; }, style: { color: '#89A54E' } }, title: { text: 'Discount', style: { color: '#89A54E' } } } 

Now comes the harder part, the tooltip:
tooltip: { formatter: function() {var unit = { 'Temperature': '°C', 'Sea-Level Pressure': 'mb','test':'' }[this.series.name]; return ''+this.x+':'+this.y ; } },
I have no idea what the Temperature part does, on the other hand I'm happy with the result, so Ill leave it unchanged.

What is left is to change the labels to fit our series (the floating window on the left).
From:
legend: { layout: 'vertical', align: 'left', x: 120, verticalAlign: 'top', y: 80, floating: true, backgroundColor: '#FFFFFF'},
 series: [ 

{name: 'Unit Price', type: 'spline', color: '#AA4643', yAxis: 1, marker: { enabled: false }, dashStyle: 'shortdot', data : []},
{name: 'Process Time', color: '#89A54E', type: 'spline', data: [] },
{name: '# of Orders', color: '#3ADF00', type: 'spline', data: [],  yAxis: 2 } ]


 I prefer the legend location on the top and a bit to the left.
To:
legend: { layout: 'vertical', align: 'left', x: 60, verticalAlign: 'top', y: 1, floating: true, backgroundColor: '#FFFFFF'},
series: [ {name: 'Revenue', type: 'spline', color: '#AA4643', yAxis: 1, marker: { enabled: false }, dashStyle: 'shortdot', data : []},
{name: 'Billed Quantity', color: '#89A54E', type: 'spline', data: [] },
{name: 'Disscount Amount', color: '#3ADF00', type: 'spline', data: [],  yAxis: 2 }]


So the result is:

The complete Narrative is now (of course remember to check the "Contains HTML Markup"):

Header:

<script type='text/javascript' src='/analyticsRes/SampleApp/Scripts/highcharts/JQuery/jquery-1.8.2.min.js'></script>
<script src='/analyticsRes/SampleApp/Scripts/highcharts/highcharts.js'></script>
<script src='/analyticsRes/SampleApp/Scripts/highcharts/modules/exporting.js'></script>
<script type='text/javascript'>
$(function() {
var options = {
           chart: { renderTo: 'container2', zoomType: 'xy' },
                    title: { text: 'Sample of Three different scale on the same chart' },
                                                subtitle: { text: 'My Sample' },
                                                xAxis: [{ categories: [] }],
                                                yAxis: [
              { labels: { formatter: function() { return this.value +' USD'; }, style: { color: '#89A54E' } }, title: { text: 'Revenue', style: { color: '#89A54E' } } },
              { gridLineWidth: 0, title: { text: 'Billed Quantity', style: { color: '#AA4643' } }, labels: { formatter: function() { return this.value +' Units'; }, style: { color: '#AA4643' } }, opposite: true },
              { labels: { formatter: function() { return this.value +'USD'; }, style: { color: '#89A54E' } }, title: { text: 'Discount', style: { color: '#89A54E' } } }
                                                ],
               tooltip: { formatter: function() {var unit = { 'Temperature': '°C', 'Sea-Level Pressure': 'mb','test':'' }[this.series.name]; return ''+this.x+':'+this.y ; } },
                 legend: { layout: 'vertical', align: 'left', x: 60, verticalAlign: 'top', y: 1, floating: true, backgroundColor: '#FFFFFF'},
                           series: [
                                {name: 'Revenue', type: 'spline', color: '#AA4643', yAxis: 1, marker: { enabled: false }, dashStyle: 'shortdot', data : []},
                                {name: 'Billed Quantity', color: '#89A54E', type: 'spline', data: [] },
                               {name: 'Disscount Amount', color: '#3ADF00', type: 'spline', data: [],  yAxis: 2 } ]
                           };


Body:

options.series[0].data.push(parseFloat("@2".replace(" ", "")));
options.series[1].data.push(parseFloat("@3".replace(" ", "")));
options.series[2].data.push(parseFloat("@4".replace(" ", "")));
options.xAxis[0].categories.push('@1');                                               


Postfix:

var chart = new Highcharts.Chart(options);
});
</script>
<div id='container2' style='min-width: 850px; height: 400px; margin: 0 auto'></div>


Looks better, but there is some work to be done.


So since stealing java scripts from Oracle VM is not easy (And not the best policy); I wanted to be sure I can download the relevant scripts myself.

So I downloaded:
1. A newer version of jQwuery from jquery.com, specifically, Download the compressed, production jQuery 1.10.2.
2. Downloaded Highcharts 3.0.2 from http://www.highcharts.com/download
 extracted HighCharts.
Replaced the files at analyticsRes, had to do some minor modifications to the Narrative (jquery file is 1.10.2 now and not 1.8.2. Slightly different File Name).

And .... All is working fine. 


OBIEE 11.1.1.7 - Working with Hadoop / Hive (Real-World Case)

Dec-2015 remark:  Please note this is an old post. For better results with Hadoop, Impala, Hive... please use OBIEE 11.1.1.9 or later.


A colleague of mine, Tovit, has done a POC with OBIEE 11.1.1.7, on top of Hadoop (few Petabytes), using Hive. While she was working, I took the role of "fly on the wall" and did some documentation.
There are 3 good sources for relevant information at the moment:
1. From Support.oracle.com, the note OBIEE 11g: Using Oracle Hadoop ODBC Driver with BI Administration Tool [ID 1520733.1].
2. Oracle Documentation here.
Since I mostly write this blog for myself, I wanted it to be slightly more detailed than that blog.

The guideline is to use OBIEE on Linux if you want to work with Hadoop. Why? A good reason is "because the people that developed the product tells you so". I can add one more, we tried it on Windows box as well and Linux OBIEE works much better.

The support note "describes how to use the Oracle Apache Hadoop Hive ODBC Driver with the Oracle BI Administration tool for the purpose of creating Oracle BI metadata from Hadoop Data sources" and attach 32-bit and 64-bit versions of the driver. So download the ODBC drivers for Hive from this note and install them on your Administrator PC.
Remember to run the install.bat as Windows Administrator (otherwise you can't have access to registry). So the result is:

Run the Data sources(ODBC) from Control Panel /  Administrative Tools on Windows. Under System DSN Add a new data source of Apache Hadoop Hive.
Fill relevant data, while Port and Database refer to Hive definitions:
 We didn't change the defaults for the other tabs.

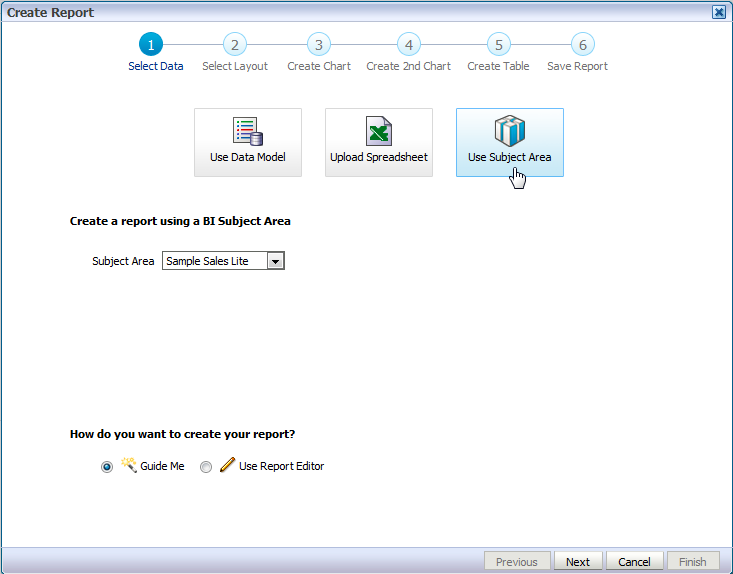
Now from the client OBIEE Administration you can import the data structure using the Hadoop Hive ODBC definition (File -> Import Metadata -> ODBC 3.5).

After the import change the Database definition to Apache Hadoop.


Leave the connection pool to be ODBC 2.0.

 We had one problem at this moment. For some reason the a column that was used for partitioning, was not imported. So we had to add it manually.
One more advise, all the columns should be nullable.

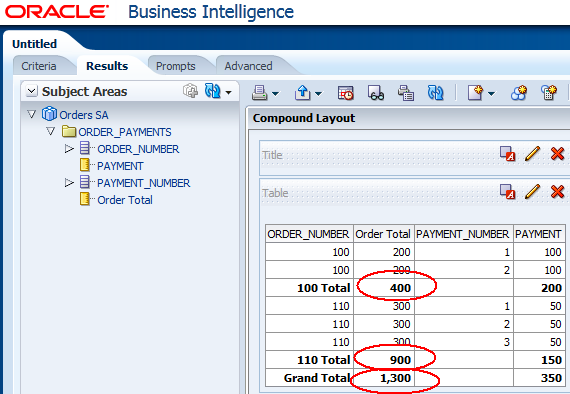
At this point you should be able to see the data (right click, View Data). Next is standard OBIEE repository work.

Now we move to the OBIEE Linux server.
In 11.1.1.7 the Hive ODBC by DataDirect are already installed.
You have to modify the odbc.ini file, this one:
oracleHome/instances/instance1/bifoundation/OracleBIApplication/coreapplication/setup/odbc.ini

As always the server ODBC, should fit the Administrator ODBC name.

We added the following, non black part (replace XXXXXX, YYYYYY, ZZZZZZ with your values):

[ODBC Data Sources]
AnalyticsWeb=Oracle BI Server
Cluster=Oracle BI Server
SSL_Sample=Oracle BI Server
OBIEELNX=Oracle 7.1 Apache Hive Wire Protocol

[OBIEELNX]
QEWSD=2456476
Driver=/opt/oracle/obiee/Oracle_BI1/common/ODBC/Merant/7.0.1/lib/ARhive27.so
Description=DataDirect 7.1 Apache Hive Wire Protocol
ArraySize=16384
Database=default
DefaultLongDataBuffLen=1024
EnableDescribeParam=0
HostName=XXXXXXXXX
LoginTimeout=30
LogonID=ZZZZZZZZZZ
MaxVarcharSize=2147483647
Password=YYYYYYYYYY
PortNumber=10001
RemoveColumnQualifiers=0
StringDescribeType=12
TransactionMode=0
UseCurrentSchema=0

See another example in the documentation here.

Locate the opmn.xml file 
oracleHome/instances/instance1/config/OPMN/opmn/opmn.xml

In the file, Locate the coreapplication_obis1 tag, and within that tag, locate the LD_LIBRARY_PATH variable. Ensure that the LD_LIBRARY_PATH variable includes the path to the DataDirect 7.0.1 driver, namely ORACLE_HOME/common/ODBC/Merant/7.0.1/lib.

In the same opmn.xml file, either above or below the LD_LIBRARY_PATH variable, create the HADOOP_DLL variable to point to the DataDirect 7.0.1 driver.

For example:
<variable id="HADOOP_DLL"
value="ORACLE_HOME/common/ODBC/Merant/7.0.1/lib/ARhive27.so"/>


Save and close the file.

Restart OPMN.

Create a soft link libARicu27.so pointing to libARicu26.so.
For example:
cd /usr/Oracle_BI1/common/ODBC/Merant/7.0.1/lib/
ln -s libARicu26.so libARicu27.so


In Oracle documentation there is a bit misleading  part, at the moment, starting with Acquiring Windows Driver to Enable Data Import Using Administration Tool and till the end of the subject (the limitation part). Since we did it already with the drivers provided by the support, we don't need to do it as described in the document.


Now you are ready to go.


When the queries run you can clearly see the steps in the Session Manager:
Executing, Preparing, Fetching, fetched, Preparing.
 
We couldn't cancel a query during the Executing stage.

It seems Oracle has done a good job here and the results seems encouraging.