For some reason, BI Publisher and Answers have a different set of possible graphs (named Graphs in Answers - Analysis and Charts in Publisher - Report).
In BI Publisher there are some very interesting dual Y bar Charts:
In BI Publisher there are some very interesting dual Y bar Charts:
For Lines:

For Areas:

For bars:

And even for scattered points:

The big advantage here, comparing to other techniques I talked about (OBIEE dual Y line chart / graph using Javascript, OBIEE - Narrative and dual Y axis Google Chart), is the integration with OBIEE Semantic model in the latest releases. So I can do a report directly on top of a Subject area or (in earlier releases), on top of an Analysis.
For example:
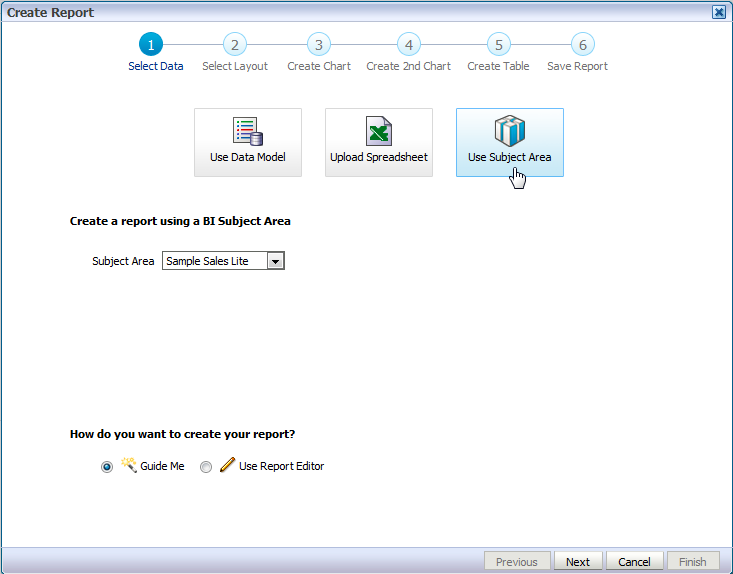
Lets create a new report:

And base it on a Subject Area (Sample Sales Lite, in this case)

I don't want any guide and use a report editor.
Lets save the report and select any template you like. I took the empty one.
I'll drag a chart object from the Insert option.

And put relevant column in the chart. Do not drag anything to the Series. It will prevent the dual Y option. You want 2 measures at the Values part.

Click on the Chart.
In the Chart menu select the Dual Line or whatever dual type you want.

We are almost done:

Now Save the layout and the report.
You might want to make the entire report smaller by clicking an empty part of the layout and selecting properties on the left:

And add the Report to the dashboard of your choice.
Here you have 2 problems:
1. You can't print Publisher report in a dashboard a part of the Dashboard. Not even as HTML as the 2 other option could.
According to Oracle documentation (Users Guide, Chapter 4):
About Briefing Books and Printing BI Publisher Reports
If you plan to print a dashboard page that contains a BI Publisher report or to include the page in a briefing book, then you must keep the following points in mind:-
If you print the briefing book as PDF and if the output format of the
BI Publisher report is PDF, then the BI Publisher report is printed
after the other objects on the page. If you print a dashboard page that
contains a BI Publisher report as PDF, but the dashboard page is not
part of a briefing book, then the BI Publisher will not be printed.
-
If you print the dashboard page or briefing book as MHTML, then the BI Publisher report will not be printed.
Starting with 11.1.1.7 you can semi automatically create a publisher report out of the entire dashboard page, and print it.
2. The Publisher reports in Dashboard keep their header.

You can solve the first problem by embedding a link and not the actual Publisher Report in the dashboard.For example press Export

Remove the server name and port and all the sufixes.
For example, now I have 2 URLs:
Interactive:
/xmlpserver/viewer.jsp?_xpf=&_xpt=1&_xdo=%2F~weblogic%2FPub_dualY.xdo&_xmode=2&_xt=Dual+Y+Chart
(the original URL was: http://bdahab-lap:9704/xmlpserver/viewer.jsp?_xpf=&_xpt=1&_xdo=%2F~weblogic%2FPub_dualY.xdo&_xmode=2&_xt=Dual+Y+Chart&_xf=analyze&_xautorun=false&_xana=view )
HTML:
/xmlpserver/servlet/xdo?_xpt=1&_xdo=%2F~weblogic%2FPub_dualY.xdo&_xt=Dual%20Y%20Chart&_xf=html
I placed both in Embedded content objects:

The result is

Pick your own choice.
You might want to see:OBIEE - Dual Y axis line and Dual axis Bar charts: the easy, unsupported and not recommended way
No comments:
Post a Comment