I want to talk about the new visualization options in DVD 12.2.2.0 and about adding custom visualizations to DVD. The one thing I want to remind myself is the location: C:\Users\YOUR_USER_NAME\AppData\Local\DVDesktop where to place the plugins. I will get back to this later.
I marked the new visualizations here:

Lets see them.
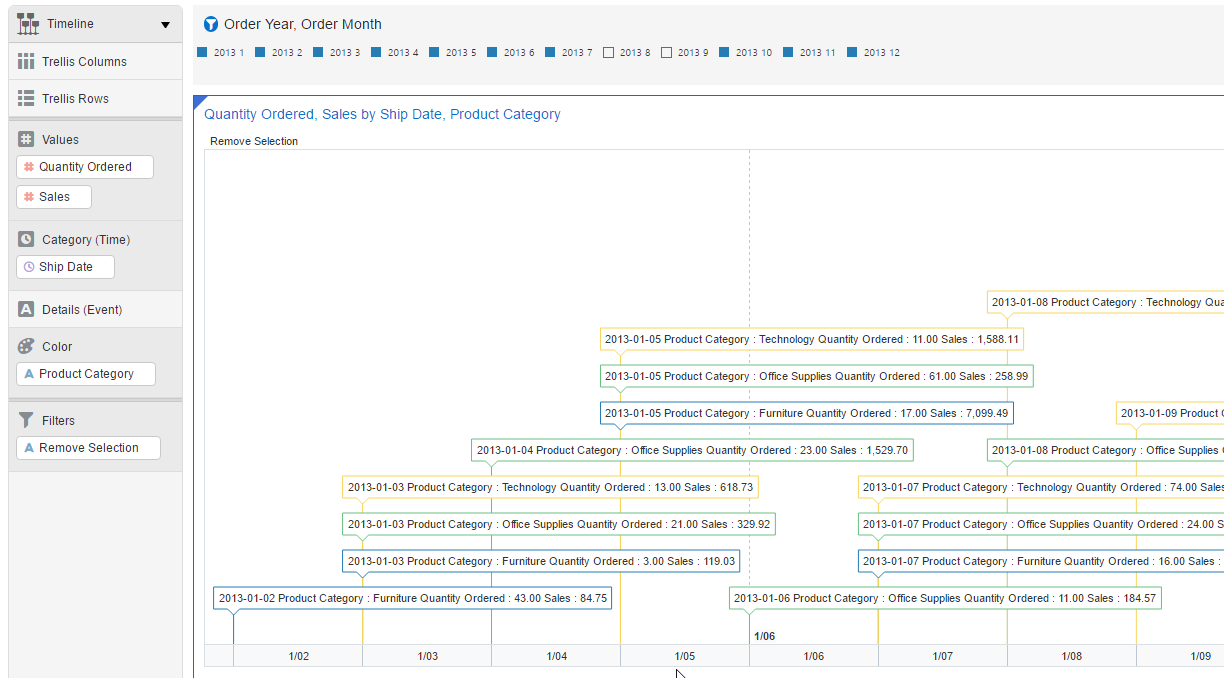
List and Timeline.
The list lets you get a list of values. In my case I selected Year and Month. and changed the layout in properties to horizontal. After turning on the "Use as filter" option I described here, any click on list values filter the other visualizations, in this case the timeline.
The timeline shows event on a timeline. So only dates and date dimensions can be there at the Category (Time).

For timeline we can control the time axis using properties, but I guess most of us will just use the zoom in / out buttons and drag the line left and right.

Tree and Sankey:
Here is a Tree (left) and Sankey (right) visualization of "Product Category" and "Product Sub Category" with Color by "Profit" and Size by "Sales". Both Color and Size must be measures.

Circular Network, Network and Chord diagram
Here is the relations between "Product Category" and "Customer Segment" based on Color by "Profit" and Size by "Sales".Both Color and Size must be measures. Using Circular Network (left) and Chord diagram (right).

Here is Network visualization of the same:

Parallel Coordinates
Here is Parallel Coordinates of relations between "Product Category" and "Customer Segment" and "Quantity Ordered" with line color by "Profit":

In the new DVD there is an option of custom visualizations. We can create new visualizations using the SDK. Serious people can see the YouTube video here, read the documentation here or see tutorial here. I'm sure I will do it when I grow up (or have to), but at the moment I wanted to use custom visualization someone else prepared.
Like the ones marked here:
New visualization types
You can see a good YouTube video here about the new visualization types.I marked the new visualizations here:

Lets see them.
List and Timeline.
The list lets you get a list of values. In my case I selected Year and Month. and changed the layout in properties to horizontal. After turning on the "Use as filter" option I described here, any click on list values filter the other visualizations, in this case the timeline.
The timeline shows event on a timeline. So only dates and date dimensions can be there at the Category (Time).
For timeline we can control the time axis using properties, but I guess most of us will just use the zoom in / out buttons and drag the line left and right.

Tree and Sankey:
Here is a Tree (left) and Sankey (right) visualization of "Product Category" and "Product Sub Category" with Color by "Profit" and Size by "Sales". Both Color and Size must be measures.

Circular Network, Network and Chord diagram
Here is the relations between "Product Category" and "Customer Segment" based on Color by "Profit" and Size by "Sales".Both Color and Size must be measures. Using Circular Network (left) and Chord diagram (right).

Here is Network visualization of the same:

Parallel Coordinates
Here is Parallel Coordinates of relations between "Product Category" and "Customer Segment" and "Quantity Ordered" with line color by "Profit":

Custom Visualizations
In the new DVD there is an option of custom visualizations. We can create new visualizations using the SDK. Serious people can see the YouTube video here, read the documentation here or see tutorial here. I'm sure I will do it when I grow up (or have to), but at the moment I wanted to use custom visualization someone else prepared.
Like the ones marked here:

You can see a video about available plugins here.
Plugins can be found at the public store.
(Or actually, if you want the full path:
If you look at the DVD community space here, there is a link from there to samples here. The actual link is at the middle of the screen and points to the public store, here.)
At the moment you can find the following plugin visualizations there:

Now we come to the point, that forced me to write this blog. WHERE to put the zip files after I download them? It took me several annoying minutes to find.
All we have to do is place the zip files, as they are (no need to unzip) at the following location on your PC: C:\Users\YOUR_USER_NAME\AppData\Local\DVDesktop.
Since "YOUR_USER_NAME" is probably not your user name on the computer, you should replace it with the actual one.
Once the zip files are there, restart DVD and the new visualizations are ready to use.
Here are few examples:
Calendar Heatmap (naturally has to do with calendars and dates): Here profit by Order date:

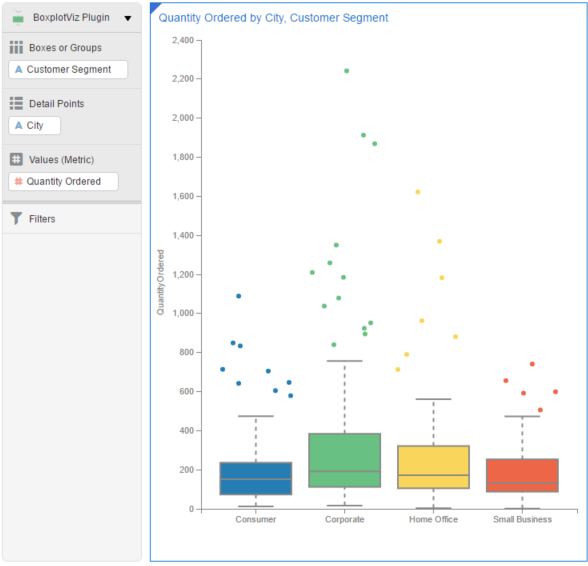
Boxplot, that is good for data scientist to see the statistical distribution of the data:

Circle Pack, in this case Profit with Circles by Product Sub Categories, colored by Customer Segment.

Candle Sticks, Oracle stock behavior, 2008-2012. The bottom graph is a scrolling bar for the 2 upper.

Since "YOUR_USER_NAME" is probably not your user name on the computer, you should replace it with the actual one.
Once the zip files are there, restart DVD and the new visualizations are ready to use.
Here are few examples:
Calendar Heatmap (naturally has to do with calendars and dates): Here profit by Order date:

Boxplot, that is good for data scientist to see the statistical distribution of the data:
Circle Pack, in this case Profit with Circles by Product Sub Categories, colored by Customer Segment.

Candle Sticks, Oracle stock behavior, 2008-2012. The bottom graph is a scrolling bar for the 2 upper.

If I publish DVA file to DV server, will it be working for plugin function ?
ReplyDeleteThis is a better place for the question:
Deletehttps://community.oracle.com/community/business_intelligence/data-visualization