Saturday, December 29, 2012

OBIEE - You should be Mapping 5 - report based coordinates

זה הזמן להתוודות. פספסתי בענק אופציה חשובה ומעניינת במפות של OBIEE. היכולת לעבוד עם קוארדינטות של נקודות על מפה הלקוחות מהדוח עצמו.
כדי לעבוד עם מפות בOBIEE אמנם צריך איזה שהוא קישור לשכבת המפות שהוגדרה באדמיניסטציה כמו שתואר בפוסט השני מתוך הבאים:

OBIEE - You should be mapping, yeah

OBIEE - You should be mapping 2

OBIEE - You should be Mapping 3

OBIEE - You should be Mapping 4 - Master / Detail

אבל לא באמת חייבית לכלול את השדה הרלוונטי בדוח. על מה אני מדבר? נדגים:

יצרתי טבלה בבסיס הנתונים ובה שם הקניון, נקודות אורך ורוחב שהוצאתי מהמפות של גוגל, כמות החנויות שבקניון ושטח הקניון. הוספתי עמודה בה שם המדינה (Israel). ייבאתי את הטבלה באדמיניסטרטור של OBIEE וקישרתי אותה לטבלת המדינות (שכבר מוגדרת בהגדרות השכבות של המפות).
עכשיו יצרתי דוח על הטבלה החדשה בלבד ומערכת המפות עבדה ולא הודיע שגיאה על העדר קשר למפות.
מה עשיתי הלאה? אדגים:
הוספתי מפה:
כשנכנסים לערוך את המפה רואים שאין, כצפוי, שכבת ברירת מחדל. אבל גם אין שגיאה.
עכשיו נבחר בNew Map Format. במקרה שלי בחרתי בפורמט מסוג Bubble.
הנקודה החשובה היא לבחור באופציה האחרונה - Custom Point Layer. זה מה שאומר למוצר לעבוד עם הקוארדינטות שלכם.
מופיעה חלונית של הגדרות:
שימו לב שהוא כבר ניחש לבד על פי שמות העמודות, מה להגדיר כקוי אורך ומה כגובה. נחמד.
ניתן גם להגדיר את שני הערכים בעמודה אחת. אז תאלצו להגדיר את התו המפריד.
היתר, אלו כבר ההגדרות הרגילות של מה להציג כתוכן ובאיזו תצורה. והנה התוצאה:
ברור שבמקרה זה יש צורך להשתמש במפות של Google או Bing. המפות המובנות של Navteq המגיעות עם המוצר לא מכילות את רמת הפירוט הנדרשת.

עוד דבר אחד. אם אתם לוקחים את הקוארדינטות מGoggle, שימו לב שהוא מחזיר צמד ערכים בסדר הבא:  (Latitude, Longitude).


Friday, December 28, 2012

OBIEE and tiles without Narrative

In the past I wrote about OBIEE and Narrative - simple Tile. In the extended Oracle Business Intelligence Samples you can see a tile sample with presentation based on Pivot table:

How was it done?
I created a basic report:

The last column has no meaning, we just need something to be in the measures part. In my case I decided to have a column of NULLs with space as a label.

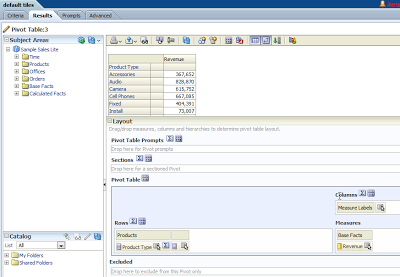
So I create a Pivot:

And rearrange it:

Now we need to arrange the Product Type and Revenue so each pair will look like a single tile and hide the measures. The last part is the most interesting: how to hide the leftmost part.
So on the rows properties, remove the Display Heading mark, to loose and extra line:

Then select format values for each column.
First the top - product type:
The important parts are: Border, font size and Background Color (I changed to white).

Something similar can be done with the second column (Revenue):
 Pay attention to the border, no bottom.

And now lets deal with the NULL column at the measure. First Format Headings:
White background color and no Border.


Now the Format Measure Values:

Lets minimize it to size of 1 and close the border at the bottom.

So what is left? We have this ugly area at the left. The bottom part of it was solved when we fixed the measure values heading. Now we need to deal with the rest.
 How do we hide it?
This is a style trick.
Add a Static Text to the Analysis. Mark as Contains HTML and paste the following:

<style>.PTCC {   background-color: white;   border-top: white;   border-left: white;}</style>

Now it's perfect:

Naturally Drills and Navigate options work:

When I drill on the Accessories:


Wednesday, December 26, 2012

TheMarket 26/12/2012 & cheating graphs

הפעם לא נדבר על אורקל בכלל. היום נדבר על גרפים שמרמים.

היום פתחתי את השער האחורי של המהדורה המודפסת של TheMarker וראיתי את הגרפים הבאים:
(הקישור לכתבה המכילה את הגרפים: http://www.themarker.com/markets/1.1893970)

מה שטרד את מנוחתי היה הגרף הימני:
למה? כי ברור שזה גרף מרמה.

היחס בין הערכים הוא 184/105 שזה בערך 1.75.
עשיתי בדיקה ידנית (לא מושלמת) של רדיוס כל עיגול בפיקסלים:
  רדיוס העיגול הגדול הוא כ218 פיקסלים.
  רדיוס העיגול הקטן הוא כ115 פיקסלים.

כשמדברים על צורות דו מימדיות בכלל ועיגולים במיוחד, הערך החשוב הוא השטח. למי שזוכר, הנוסחא של
שטח עיגול שרדיוסו \ R היא \ S = \pi R^2.
לכן היחס בין השטחים הוא מנת הריבועים של הרדיוס, או בעברית: 218/115 בריבוע.
שזה בערך 3.6.

מכאן אנו מגלים את מקדם השקר של הגרף שהוא היחס בין הערך המוצג לערך בפועל: 3.6/1.75.

מקדם השקר שלנו בגרף זה הוא ~ 2.06.

איך אומר נחמיה שטרסלר: שלא יעבדו עליכם.

Tuesday, December 18, 2012

OBIEE Images and Pictures

For the previous posts about Narrative, I needed to have images on my BI server, available for access via URL. 
My server names is bdahab-il, it's a simple installation, so the port is 7001. I installed OBIEE in the c:\or\bi folder.
I placed an image (Good_Morning1.jpg) on the server at C:\or\BI\user_projects\domains\bifoundation_domain\servers\AdminServer\tmp\_WL_user\analytics_11.1.1\silp1v\war
(INSTALLATION_FOLDER\user_projects\domains\bifoundation_domain\servers\AdminServer\tmp\_WL_user\analytics_11.1.1\silp1v\war) and received Error 404 when tried the appropriate URL (http://bdahab-il:7001/analytics/Good_Morning1.jpg) :

And said @#!$%%!!
Restarted the server...Then the URL http://bdahab-il:7001/analytics/Good_Morning1.jpg
worked. Please note it's case sensitive, Good_Morning1.JPG wouldn't work.

Talking about images... just a reminder: Oracle has a set of images on the server. They are placed by default at:  INSTALLATION_FOLDER\user_projects\domains\bifoundation_domain\servers\AdminServer\tmp\_WL_user\analytics_11.1.1\silp1v\war\res\s_blafp\images. 
You can access them using fmap:images/name. For example, the logo here: 

is referred as fmap:images/report_medicalResearch.jpg 

You usually use them in the Logo and when creating conditional format with your own images:
The result for example is:


So if you want to see the entire library Oracle prepared for fmap, visit
INSTALLATION_FOLDER\user_projects\domains\bifoundation_domain\servers\AdminServer\tmp\_WL_user\analytics_11.1.1\silp1v\war\res\s_blafp\images 
Here is a picture of them:
And one more reminder: if you want to add images that are not lost each upgrade, create your own skin and style as described at the white paper Customizing Oracle Business Intelligence Enterprise Edition 11g.

You might want to read Gerard Nico on the issue http://gerardnico.com/wiki/dat/obiee/image. There is one point I don't agree with him totally, and that is: picture presentation in a report. The easiest way is to have the URL for the image in a column as value (or directly at my example) and define the data format as image URL:


Results in:


Monday, December 17, 2012

OBIEE - Narrative and dual Y axis Google Chart


So I needed a graph with 2 side (Y) axis. In OBIEE there is an option of Line-Bar of this kind, but I needed 2 lines. So I decided to use Google Visualization, as was covered in the last post.
One personal word of caution: In OBIEE 10g there was a trick that allowed this sort of graphs. Few cases I new that used it, stoped eventually because "the customer doesn't understand what line belongs to what axis".
Still, in a POC you need to be able to show all is possible, then to explain...

I created a table with 5 columns:
Year, Month-1, DOM (Day of Month), Revenue and Quantity from Sample Sales. (It's Month-1 because in java-scripts January is month no. 0, February=1...)

I went to Google  Playground - Advanced - Annotated Time Line. The original code was:

function drawVisualization() {
  var data = new google.visualization.DataTable();
  data.addColumn('date', 'Date');
  data.addColumn('number', 'Sold Pencils');
  data.addColumn('string', 'title1');
  data.addColumn('string', 'text1');
  data.addColumn('number', 'Sold Pens');
  data.addColumn('string', 'title2');
  data.addColumn('string', 'text2');
  data.addColumn('number', 'Sold Papers');
  data.addRows([
    [new Date(2009, 1 ,1), 30000, null, null, 4645, null, null, 12345],
    [new Date(2009, 1 ,2), 14045, null, null, 2374, null, null, 44444],
    [new Date(2009, 1 ,3), 55022, null, null, 5766, null, null, 76545],
    [new Date(2009, 1 ,4), 75284, null, null, 1334, 'Out of Stock', 'Ran out of stock on pens at 4pm', 16345],
    [new Date(2009, 1 ,5), 41476, 'Bought Pens', 'Bought 200k pens', 6467, null, null, 41345],
    [new Date(2009, 1 ,6), 33322, null, null, 3463, null, null, 33665]
  ]);

  var annotatedtimeline = new google.visualization.AnnotatedTimeLine(
      document.getElementById('visualization'));
  annotatedtimeline.draw(data, {
                  //'allValuesSuffix': '%', // A suffix that is added to all values
                  'colors': ['blue', 'red', '#0000bb'], // The colors to be used
                  'displayAnnotations': true,
                  'displayExactValues': true, // Do not truncate values (i.e. using K suffix)
                  'displayRangeSelector' : false, // Do not sow the range selector
                  'displayZoomButtons': false, // DO not display the zoom buttons
                  'fill': 30, // Fill the area below the lines with 20% opacity
                  'legendPosition': 'newRow', // Can be sameRow
                   //'max': 100000, // Override the automatic default
                   //'min':  100000, // Override the automatic default
                   'scaleColumns': [0, 1], // Have two scales, by the first and second lines
                   'scaleType': 'allfixed', // See docs...
                   'thickness': 2, // Make the lines thicker
                   'zoomStartTime': new Date(2009, 1 ,2), //NOTE: month 1 = Feb (javascript to blame)
                   'zoomEndTime': new Date(2009, 1 ,5) //NOTE: month 1 = Feb (javascript to blame)
              });
}

In the Playgraound I changed it to fit my needs. (Nothing big, removed few Columns, changed few presentation options...)

function drawVisualization() {
  var data = new google.visualization.DataTable();
  data.addColumn('date', 'Date');
  data.addColumn('number', 'Revenue');
  data.addColumn('number', 'Quantity');
  data.addRows([
    [new Date(2009, 1 ,1), 30000, 34645],
    [new Date(2009, 1 ,2), 14045, 44444],
    [new Date(2009, 1 ,3), 55022, 76545],
    [new Date(2009, 1 ,4), 75284, 16345],
    [new Date(2009, 1 ,5), 41476, 41345],
    [new Date(2009, 1 ,6), 33322, 33665]
  ]);

  var annotatedtimeline = new google.visualization.AnnotatedTimeLine(
      document.getElementById('visualization'));
  annotatedtimeline.draw(data, {
                                //'allValuesSuffix': '%', // A suffix that is added to all values
                                'colors': ['blue', 'red', '#0000bb'], // The colors to be used
                                'displayAnnotations': false,
                                'displayExactValues': true, // Do not truncate values (i.e. using K suffix)
                                'displayRangeSelector' : true, // Do not sow the range selector
                                'displayZoomButtons': false, // DO not display the zoom buttons
                                'fill': 0, // Fill the area below the lines with 20% opacity
                                'legendPosition': 'newRow', // Can be sameRow
                                'scaleColumns': [0, 1], // Have two scales, by the first and second lines
                                'scaleType': 'allfixed', // See docs...
                                'thickness': 2, // Make the lines thicker
                               });
}

Next I need to replace the data addrows block:
data.addRows([
    [new Date(2009, 1 ,1), 30000, 34645],
    [new Date(2009, 1 ,2), 14045, 44444],
    [new Date(2009, 1 ,3), 55022, 76545],
    [new Date(2009, 1 ,4), 75284, 16345],
    [new Date(2009, 1 ,5), 41476, 41345],
    [new Date(2009, 1 ,6), 33322, 33665]
  ]);
 
With:
      var myArray=[];
      myArray.push([new Date(@1,@2,@3), @4, @5]);
      data.addRows(myArray);

And add before the content of prefix the following:

<script type="text/javascript" src="http://www.google.com/jsapi"></script>
  <script type="text/javascript">
if(document.URL.indexOf("saw.dll?Answers") == -1)
   google.load('visualization', '1', {packages: ['annotatedtimeline']});
  
   And after the end of prefix:
  
google.setOnLoadCallback(drawVisualization);
  </script>
<body style="font-family: Arial;border: 0 none;">
<div id="visualization" style="width: 800px; height: 400px;"></div>

Please note: annotatedtimeline in  google.load('visualization', '1', {packages: ['annotatedtimeline']}); is the name of the specific visualization.

So we have now the prefix:

<script type="text/javascript" src="http://www.google.com/jsapi"></script>
  <script type="text/javascript">
if(document.URL.indexOf("saw.dll?Answers") == -1)
   google.load('visualization', '1', {packages: ['annotatedtimeline']});
function drawVisualization() {
  var data = new google.visualization.DataTable();
  data.addColumn('date', 'Date');
  data.addColumn('number', 'Revenue');
  data.addColumn('number', 'Quantity');
      var myArray=[];


The Narrative:

myArray.push([new Date(@1,@2,@3), @4, @5]);     


The postfix:

data.addRows(myArray);
  var annotatedtimeline = new google.visualization.AnnotatedTimeLine(
      document.getElementById('visualization'));
  annotatedtimeline.draw(data, {
               //'allValuesSuffix': '%', // A suffix that is added to all values
              'colors': ['blue', 'red', '#0000bb'], // The colors to be used
              'displayAnnotations': false,
              'displayExactValues': true, // Do not truncate values (i.e. using K suffix)
              'displayRangeSelector' : true, // Do not sow the range selector
              'displayZoomButtons': false, // DO not display the zoom buttons
              'fill': 0, // Fill the area below the lines with 20% opacity
              'legendPosition': 'newRow', // Can be sameRow
              'scaleColumns': [0, 1], // Have two scales, by the first and second lines
              'scaleType': 'allfixed', // See docs...
              'thickness': 2, // Make the lines thicker
          });
}
   google.setOnLoadCallback(drawVisualization);
  </script>
<body style="font-family: Arial;border: 0 none;">
<div id="visualization" style="width: 800px; height: 400px;"></div>

All I need is to create a Narrative in the Analysis and copy paste the relevant parts:

Don't forget the mark at "Contains HTML Markup" and the Rows to display (if needed).
Now Press "Show how results will look on the Dashboard":


I think there is an easier option for Dual Y line Chart, described in the post: OBIEE dual Y line chart / graph using Javacript
There is also: OBIEE dual Y bar using BI Publisher 
You might want to see:OBIEE - Dual Y axis line and Dual axis Bar charts: the easy, unsupported and not recommended way

OBIEE Narrative and Google Charts - Basic

Please note that the printing and exporting of all of the bellow, only works in HTML and MHT formats.

We covered the following Narrative issues:
Basics of Narrative.
Creating Tiles with Narrative.
OBIEE and Narrative - Drill = Navigate to BI Content.
Now lets continue with Google Charts embedded in OBIEE using Narrative.

The issue of OBIEE and Google charts is not new. It was cover in several blogs, for example by John Minkjan here and here, by Paul McGarrick here and has few very nice examples in the large Sample Application available here. (Note John uses the depreciated charts engine and not the newer visualization that has a nice playground).

I decided to summarize the issue at this blog because it took me some effort doing few things that should have been easier, considering all the examples.

There are 2 major ways to do a Google Chart with Narrative. Most of the cases you will find in the internet create one line of data and pass it to Google Chart, that is the case of the second example by John Minkjan. Others will create an Array and use it for the chart. This is the first example.
 One additional option is to embed little charts in each row as was described by Paul McGarrick. We will not talk about the last option, since it does not involve Narratives.

Most of the Visualization option are best fit to arrays. How to create an array?

In the prefix of the narrative, for each column of the output we need data.addColumn(type, name); for example: data.addColumn('number', 'Revenue');
Then definition of the array: var myArray=[];
In the narrative itself we push each row of data into the array:
myArray.push([@1,@2,@3, @4, @5]);
And in the postfix we apply it: data.addRows(myArray);

You might need to increase the "default rows to display" beyond the default 30.
In the next post I will cover a sample of dual Y chart using Google visualization.
 

Saturday, December 8, 2012

OBIEE - Drill Through with unmatching columns

אני אעצור לרגע את רצף הפירסומים באנגלית הנושא Narrative, כדי לטפל בנושא שהוזכר בפוסט האחרון שלי: תחקור באמצעות URL.

על פי רוב לא צריך את זה בOBIEE. בהנתן דוח A ודוח B, ניתן להפעיל את B מכל עמודה בA על ידי הפעלת Navigate to BI Content (B אגב יכול גם להיות דף דשבורד). כיוון שלרוב אני מפעיל את דוח B משורה מסויימת שאת ערכיה אני רוצה להעביר כפרמטר. לדוגמא, אם אני עומד בדוח A על שורת מכירות עגבניות בשנת 2011, ארצה להעביר לדוח B את הפרמטרים: מוצר=עגבניות AND שנה=2011.
כידוע, OBIEE עושה את זה אוטומטית. הוא לוקח את כל העמודות הנמצאות בקריטריון משמאל לעמודה עליה אני עושה תחקור ומעביר לדוח B את הרצף של Formula=value עבור כל אחת. אם בדוח B קיימת עבור אותה Formula בדיוק הכנה בדמות התנאי is prompted, הכל עובד מושלם.

איפה הבעיה? לעתים רחוקות הFormula בדוח A ובדוח B חייבת להיות שונה. אז צריך לעבוד יותר. הכרתי אפילו בחורה טובה שהתעוררה מוקדם בשבת בבוקר כדי לחשוב על הנושא. למענה ולמעני יש הסבר פשוט.
האופציות השונות  סוכמו יפה לפני כמה שנים בבלוג הזה, למשל. אבל גם שם יש פיספוס קטן, בעיני (הוא כותב URL מלא של השרת ולא מתחיל בsaw.dll בלבד, כמו שמאד מומלץ לעשות).

נתמקד באפשרות של שימוש בhref והפעלת דוח OBIEE באמצעות URL. על הפעלת דוח באמצעות URL וכמה אפשרויות חכמות יותר מהמתואר כאן, ניתן לקרוא למשל באתר של Gerard Nico.

הרעיון הוא להוסיף לפורמולה של העמודה עליה יתבצע תחקור תוספת ולהגדיר אותה לא כטקסט רגיל אלה HTML. הסינטקס הוא:

'<a href=saw.dll?GO&OBIEE_URL||'>'||העמודה שרוצים להציג לצופה||'</a>'
עוד דבר לחשוב לעשות זה להמיר רווחים בסימן %20 המקובל, באמצעות
 REPLACE(THE_VALUE_PASSED, ' ', '%20')

לדוגמא: אם אני רוצה להפעיל מעמודה בדוח מסויים את הדוח בשם "Tiles Details" בנמצא בבמחיצת Visualization, ולהעביר לעמודה עם הפורמולה "Products"."Product Type" את הערך של "Products"."Product Type" בדוח הנוכחי. 
בנוסף אני מציג למשתמש משהו אחר, למשל קידומת The Product is, לפני שם קטגורית המוצרים (אחרת לא צריך את הפתרון הזה).
אכניס בפורמולה בעמודה עליה נעשה התחקור את התוכן הבא:
 '<a href=saw.dll?GO&path=/shared/Visualization/Tiles%20Details&Action=Navigate&P0=1&P1=eq&P2=%22Products%22.%22Product%20Type%22&P3='||REPLACE("Products"."Product Type", ' ', '%20')||'>'||
'the Product is - '||"Products"."Product Type"||'-xx'||'</a>'
וכמובן אזכור להגדיר את השדה בדוח כHTML ולא טקסט רגיל.

נ.ב.
1. אם מישהו מעתיק את התוכן למעלה, שימו לב שזו שורה אחת מלאה ולא כמה שורות.
2. אם לא ברור לכם מה זה כל הPx בURL...
     P0 - מספר הפרמטרים המועברים
     P1 -  התנאי בין P2 וP3.  למשל eq שבדוגמא פירושו שווה והוא הנפוץ ביותר.
     P2 - הפורמולה בדוח שבURL שמקבלת את הפרמטר.
     P3 - הערך המועבר.
רוצים יותר מפרמטר 1? תגדילו את P0 ותוסיפו עוד שלשה: P4-P6 היא הבאה.


Friday, December 7, 2012

OBIEE and Narrative - Drill = Navigate to BI Content, In English

We covered the basics of Narrative here and creating Tiles with Narrative here.

One of the main problems of Narrative is the lack of drill options, what is called now "Navigate to BI Content". On the other hand, it can be easily achieved using basic scripts and GO URL.
I will do a basic example, for more detail on GO URL in OBIEE check the Integrators guide in the product documentation and see Gerard Nicos site.

What I want to achieve is the "Click for details" button in the following that calls a detailed report and passes the Product Type value (Accessories in this case) to that report:
Before we jump to this, lets create a Narrative with with the "Click Me" option only, that navigates to specific dashboard with no parameters.

All I have to do is to create a Narrative with the following content:
<input type="button" value ="Click Me"
onclick="window.location='saw.dll?Dashboard&PortalPath=%2Fshared%2FComponents%2F_portal%2FClients'">

when "%2Fshared%2FComponents%2F_portal%2FClients" is the location of the Dashboard. You can copy/paste it from the URL of any dashboard you open.
Please notice the URL starts with saw.dll so it's indifferent to the server name etc... It took me 2 years to notice this little trick.

If you want to drill to specific Analysis, it's slightly different URL:
<input type="button" value ="Click for details"
onclick="window.location='saw.dll?Go&Path=/shared/Visualisation/Tiles%20Details&Action=Navigate'">

When "/shared/Visualisation/Tiles%20Details" is the name and location of the analysis.


What I really wanted is to open detailed report and pass the "Product Type" value to this analysis.
So I create a detailed analysis, with filter "Product"."Product Type" is prompted.This time my URL is a bit longer:
<input type="button" value ="Click for details"
onclick="window.location='saw.dll?Go&Path=/shared/Visualisation/Tiles%20Details&Action=Navigate&P0=1&P1=eq&P2=%22Products%22.%22Product%20Type%22&P3=@1'">
The last part of the URL are the parameters. I'll do basic explanation, for more details see the above mentioned resources such as Gerard Nicos site.

P0 is the number of parameters passed. In our case it's only 1, the current value of "Product Type".
P1 is the operator, in our case it's equal.
P2 is the target column name, the "%22Products%22.%22Product%20Type%22" you see is actually "Product"."Product Type"
P3 is the value. I use the first column to pass that value, so it's @1.

In you need more parameters, you apdate P0 and create additional triplet.  

And that's it. The following Narrative shows me the Tile and when the button pressed, it passes the Product Type value to the detailed report.Most of it is explained in the previous post here. The additional part is only the button.

<TABLE border=1 bgcolor=#0FFFF0 width=150>
<TR> <TD><center>
<br>
@1 <br>
<font size="6" color=@2>@3</font> <br>
<b> US $ </b><br><br>
<font color=grey> Product Revenue<br>for a Cycle<br>
<input type="button" value ="Click for details"
onclick="window.location='saw.dll?Go&Path=/shared/Visualisation/Tiles%20Details&Action=Navigate&P0=1&P1=eq&P2=%22Products%22.%22Product%20Type%22&P3=@1'">
</font></center><br></TD></TR> </TABLE>


OBIEE and Narrative - simple tile, in English

We covered the basics of Narrative here.

I was asked to create a tile, with value based color of the Number and description, some dynamic and some static.
I can do it easily in Table with some design in OBIEE, but it will have some limitation on the graphical representation. So I decided to do some very basic HTML in Narrative.
So again I created an analysis with 3 columns and a filter on Product Type (is prompted):
  • Product Type.
  • Color name based on the Value of revenue.
  • Revenue. 
The next step was to add a Narrative. I my case I need only the Narrative section. Since I want to create a new table for each value.  I wanted to use HTML so I marked "Contains HTML Markup".
_________________________________________________________________________
Lets do some very very basic HTML examples, if you don't have the knowledge, you will find numerous guides in the net:
<br> means line break
<b> - start bold font, </b> - stop bold font
 <font ....> - give some definitions of the following font, for examle: size and color. </font> - end the block influenced by the font definition.
<center> - start centered alignment, </center> finish it.

<TABLE...> Start a table definition with parameters
    border - Border size (0 or means none)
    bgcolor - the background color
    background - the background image you can see the codes in OBIEE color selector.

in Table <TR> is new row and <TD> a new table data cell.
</TR>, </TD>, </TABLE> ends the relevant objects.
_________________________________________________________________________

So I wanted a table with minimal border, I selected a random color:

<TABLE border=1 bgcolor=#0FFFF0>
I started the single row and cell in the table:
<TR> <TD>
I want the text centered and an empty line at the top:
<center><br>
I wanted the value of the Product Type (first column), then a new line:
@1 <br>
I wanted bigger font for Revenue value and to use the color I selected in column 2:
<font size="6" color=@2>@3</font> <br>

At the end I add some more text:
<b> US $ </b><br><br>
<font color=grey> Product Revenue<br>for a Cycle</font><br>

And I close it all:
 </center></TD></TR> </TABLE>

I can do the same with some background image, this time without the border:
 <TABLE background="http://www.angelfire.com/fl5/html-tutorial/a/raindrop.jpg" >
<TR> <TD><center>
<br>
@1 <br>
<font size="6" color=@2>@3</font> <br>
<b> US $ </b><br><br>
<font color=grey>Product Revenue<br>for a Cycle</font></center><br></TD></TR> </TABLE>


I will just add a line break as a Row Separator.


Just add a basic prompt and the result is:


If you need more control over the size of each cell you can use the height and width parameters of TD, for example <TD  height="200"  width="200">. Just remember that if the size of the frame is too small, the parameters will be disregarded. 


What can I do if I want them side by side? This time it is one big table so I will have to use the prefix and postfix of the Narrative (and my son wanted a Super Mario Background image):

Prefix:
<TABLE border 1  background="http://wallpaperhost.org/wp-content/gallery/10_wallpaper_hd_02/super-mario-hd-wallpaper.jpg" >
<TR>


Narrative:
 <TD><center>
<br>
@1 <br>
<font size="6" color=@2>@3</font> <br>
<b> US $ </b><br><br>
<font color=grey>Product Revenue<br>for a Cycle</font></center><br></TD>

Postfix:
</TR> </TABLE>


The HTML doesn't work?
The most common problem is to leave the numbers with a thousand seperator (this is good: 999999, this is bad: 999,999).
Turn of HTML in Narrative and see if this is the case.


You can read about Tiles with Pivot tables instead of Narrative here.

Thursday, December 6, 2012

OBIEE and Narrative - introduction, in English

One of the least used options in OBIEE is the Narrative.

Narrative has 6 parts:
1. The "Contains HTML Markup", which is self explanatory.
2. Prefix, that has code/text that comes before any row of your data.
3. Narrative, is the text that is run for each row of your data.
4. Row separator, that comes between Narrative lines.
5. Rows to display, that controls the number of rows from Narrative to use. Very ofter 1 is used here. Please note the default is 30. 
6. Postfix, that has code/text that comes after all rows of your data.

The major difference is between "Narrative" and "Row Separator" that  are repeated for each row of the analysis data and "Prefix" and "Postfix" that are used only once.
There are many interesting cases to use Narrative. In the following posts we will discuss graphical tiles (like the above one), Google Charts and maybe few more cases.

In the Narrative section you can add column values and Variables.

To add a Value you should write @N where N is the number of the column in the criteria, from left to right, starting 1.
For example to get the value of second column in a Narrative you should use @2.

Variables are similar, for example to add a presentation variable use @{Presentation Variable} in the Narrative.

So lets have a basic example:

I have an analysis with 3 columns:

Product Type, a Calculated Color name based on the Value of revenue and a Revenue.
I added a descending sort on Revenue.
I add a Narrative:
In the Narrative I wrote Top 5 Products in the prefix, then pressed the "Line Break" button two times. Marked the entire sentence and pressed on B and u buttons. I can see the result at the bottom of the screen: Top 5 Products
Since I wanted top 5 I wrote 5 in the Rows to display. It will be actually top 5 due to the sorting on Revenue.

Now I added the values for each row:
@1 revenue was @3.
 Pressed "Line Break" button, since I don't want all values in one long line.

Please note, this is not HTML Markup yet.

The result was:

But wait, the actual result on the screen is Centered:


Then press on Format:

And set Horizontal Alignment:


One more, rather trivial, point: if you don't enter line breaks, the entire result will be placed at the same line. (This will be useful for some Google chart cases, later). For example:
If I have 3 row of date with the 2 columns, they can be seen at the same line: